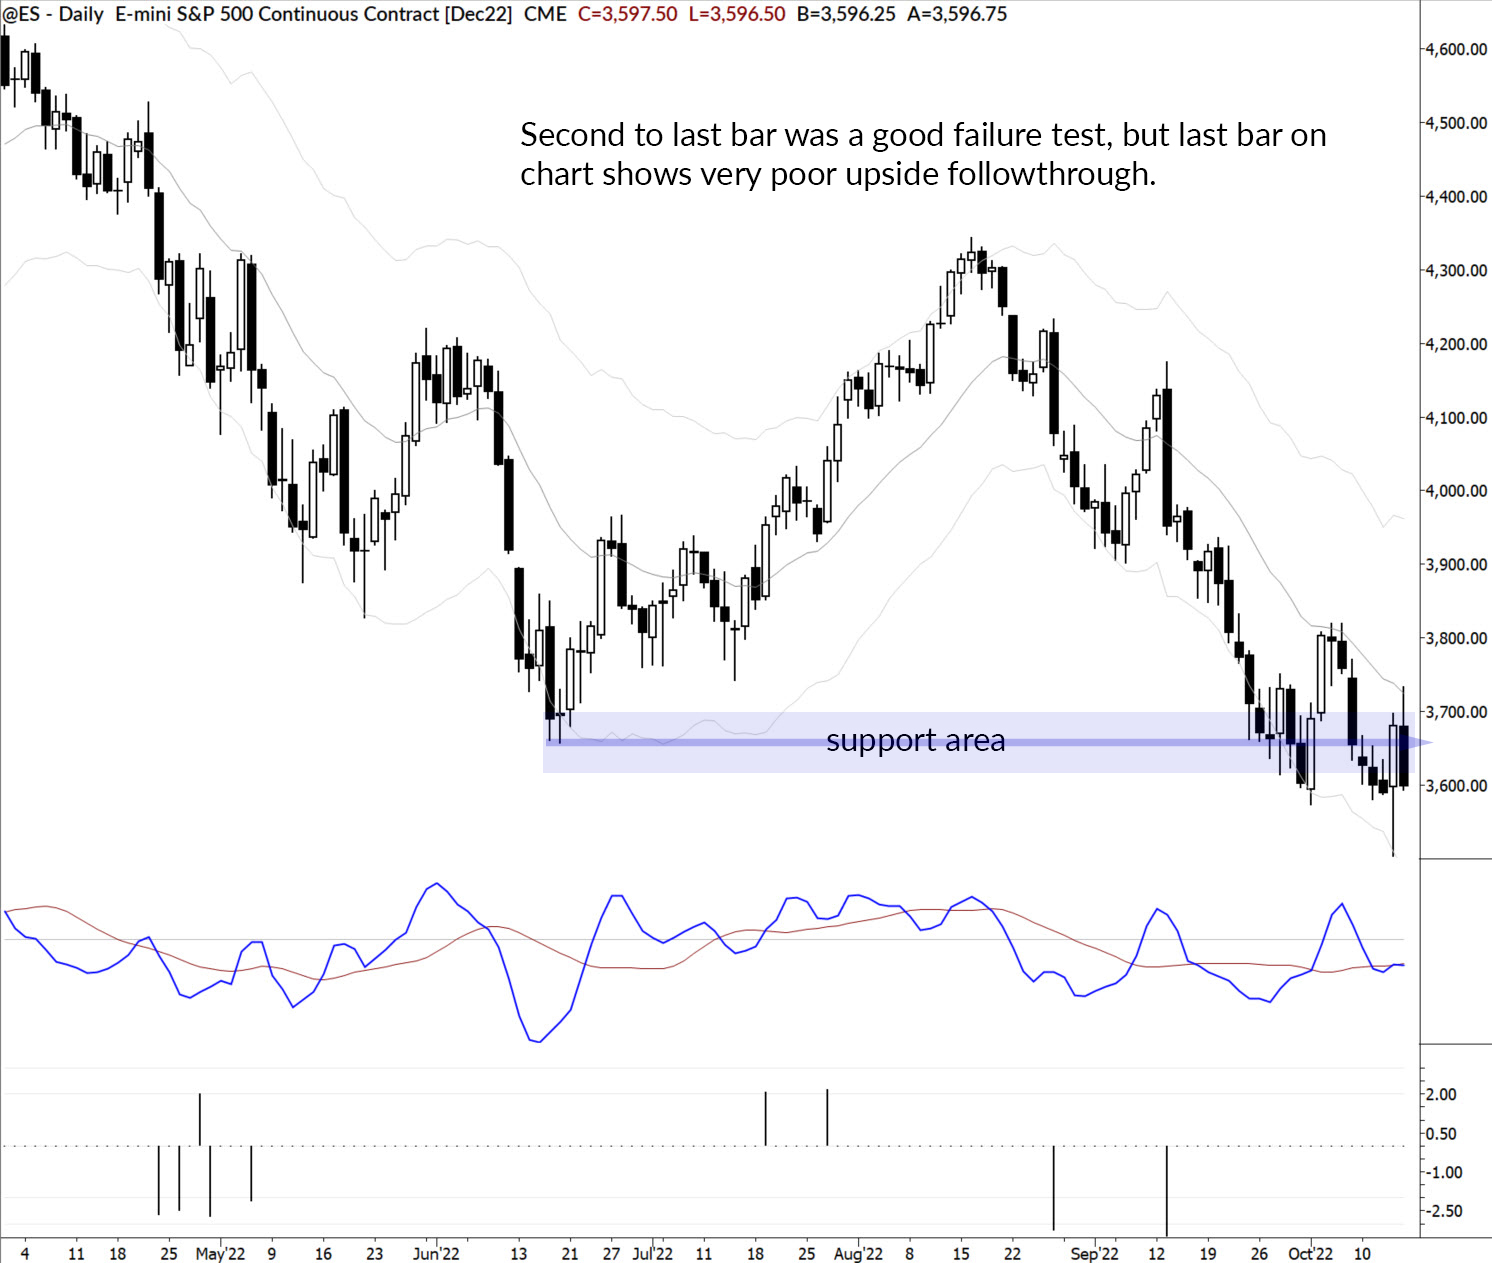
Thursday was one for the record books—stocks (and other risk assets) initially cratered under the CPI number, but quickly picked up momentum to the upside and finished the day in a stunning recovery. This kind of explosive action off a significant low (see chart) can often hammer in at least an intermediate-term bottom.
The failure test pattern
There are two lessons here. The first is a simple, repeatable pattern called the failure test. You can read more about the pattern here, but the idea is simple: a market probes beyond a significant level (which can be a visible chart point, an intraday high/low (for daytraders), or a new high/low) enough to trigger stops. When there’s no further selling pressure below support, a recovery back above that level can give a good trade entry.
One of the cleanest ways to trade this pattern is to enter on or around the close of the bar which makes a failure test. In this case, this would have meant entering on the close of the penultimate bar on the chart. Once we’ve identified a failure test, the next step is to see what follows.
Information gathering mode
At this point, we switch into what I call “information gathering mode” which means we understand the normal expectations and watch what actually happens carefully. After a major reversal from the lows, normal expectation would have been for some upside followthrough, and maybe a significant rally off the lows. It would not have been unusual to see 2-3 days “straight up” from that low.
This would have confirmed the convictions of the buyers, and likely put us into a near-term bullish mode. Note that this would have been a shift from our current bias—we’ve been leaning on the short side for quite some time.
What actually happened
If you don’t understand how to frame the action out, you might miss important things. In this case, I think Friday’s action was supremely important. The failure of the upside followthrough, and the subsequent reversal bar, closing near Friday’s open, do not bode well for future market direction.
How we are trading this market
All of this is context, and it’s valuable context, but it’s still important to focus on being absolutely disciplined with entry points. We have outlined a few scenarios that we are watching for to our MarketLife members, and we continue to see great trading opportunities for flexible traders set up each week.
If you are bullish and looking for any excuse to buy, you may well be right—we could end the year at new highs in major indexes. But it’s looking very, very unlikely. You will make the most money in trading when you align your expectations with what the market is showing us, and, currently, this is a market that gives more and more edge to the bears.
Be careful of being overly bullish. It’s just not supported by the market tone or market action.
A quick look at sectors
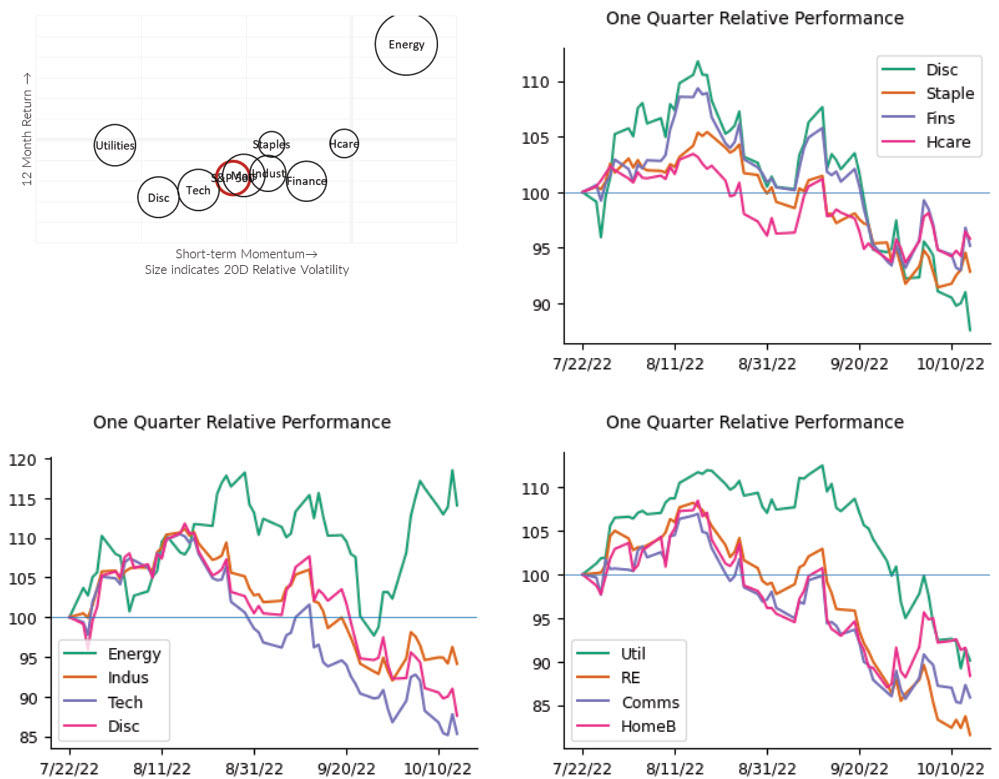
When the market is weak, more or less everything is on fire, but the persistent relative strength in Energy has been interesting. Here’s a quick snapshot (and a cool presentation) of sector relative strength. These charts are from our 50+ page Talon Advisors report, which is available completely free of charge.

The week ahead (potentially market-moving data releases)
Earnings season begins to pick up momentum. About 300 stocks report this week.
- Monday: Empire State Mfg
- Tuesday: Industrial Production
- Wednesday: Housing Starts
- Thursday: Jobs numbers, Philly Fed, EIA NG numbers
- Friday: None


