Markets Unlocked 10/10/22: Where is crude oil going?
In the interest of brevity, I’m going to write this weekend’s email almost in bullet point format. There’s a lot here, so let’s get going!
Global stocks are still under pressure
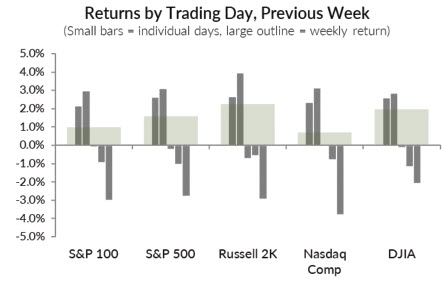
First, stocks had a yo-yo up/down week. We got the anticipated bounce off of the Panic reading on our Market Stress Index (MSI), but it that bounce only lasted a few days before the market rolled over and ended the week near lows. We maintain our intermediate-term bearish bias, and think it makes sense to pursue short-term shorts, as well. Remember, though, we certainly have a bit of a one-sided market at this time, so the possibility of sharp short covering rallies is very real.
Many measures of oversold conditions remained pegged to the downside. One of the challenges of using overbought/oversold indicators is that they will always show a trend is extended—some nuance in applying them makes all the difference in the world. For now, we’re leaning short but are respectful of the upside potential. There are specific ways we are managing positions in this environment, and we share these every day with our MarketLife members. (This might be a good time to check out our membership options with a $7 trial for your first month.)

Shorting stocks is a difficult and complicated proposition. In fact, you could make a (strong) argument that it’s just not a smart thing to do. And, yet, we do it at times. (And, for the record, we’re pretty good at it.) I’m preparing a blog post on this topic, so keep an eye out for that (hopefully arriving over the weekend.) How, when, where, and why are important questions for anyone shorting, and the most important questions are how will you know when you’re wrong and where will you get out?
Sector shifts
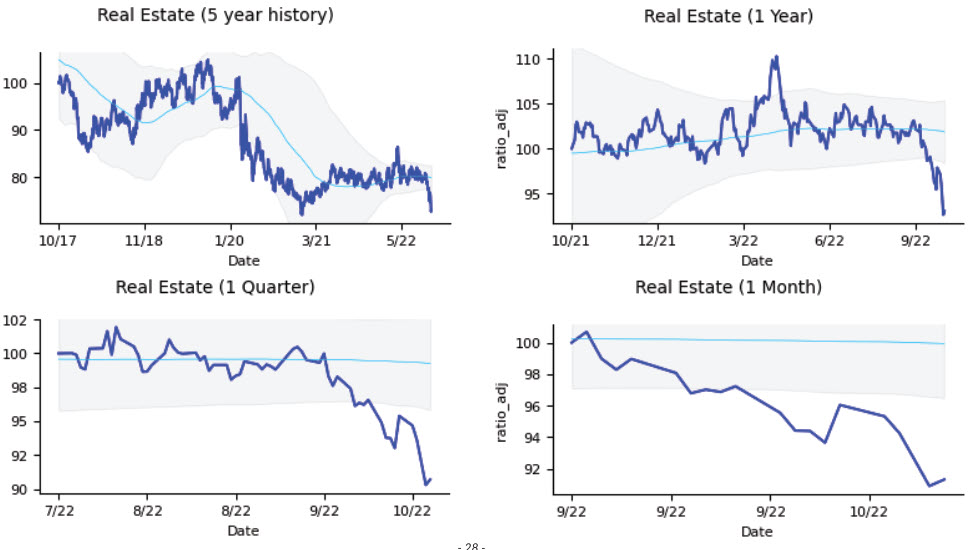
One of the more impressive moves in the market is the recent relative weakness in Real Estate. (See, for instance, IYR and other ETFs.) The chart below shows the relative performance of the sector to the S&P 1500. We’ve seen some other interesting shifts, including minor relative weakness in some key defensive sectors. At this point, we think most of these moves are noise, but are watching for them to develop into something more.

By the way, you can get this chart and a lot of other data every week by signing up for our completely free Talon Advisors report. Yes, that’s right, we’re sharing much of the data behind our macro analysis and it’s now available at no charge. Sign up here for the free report.
Crude oil, bullish bias
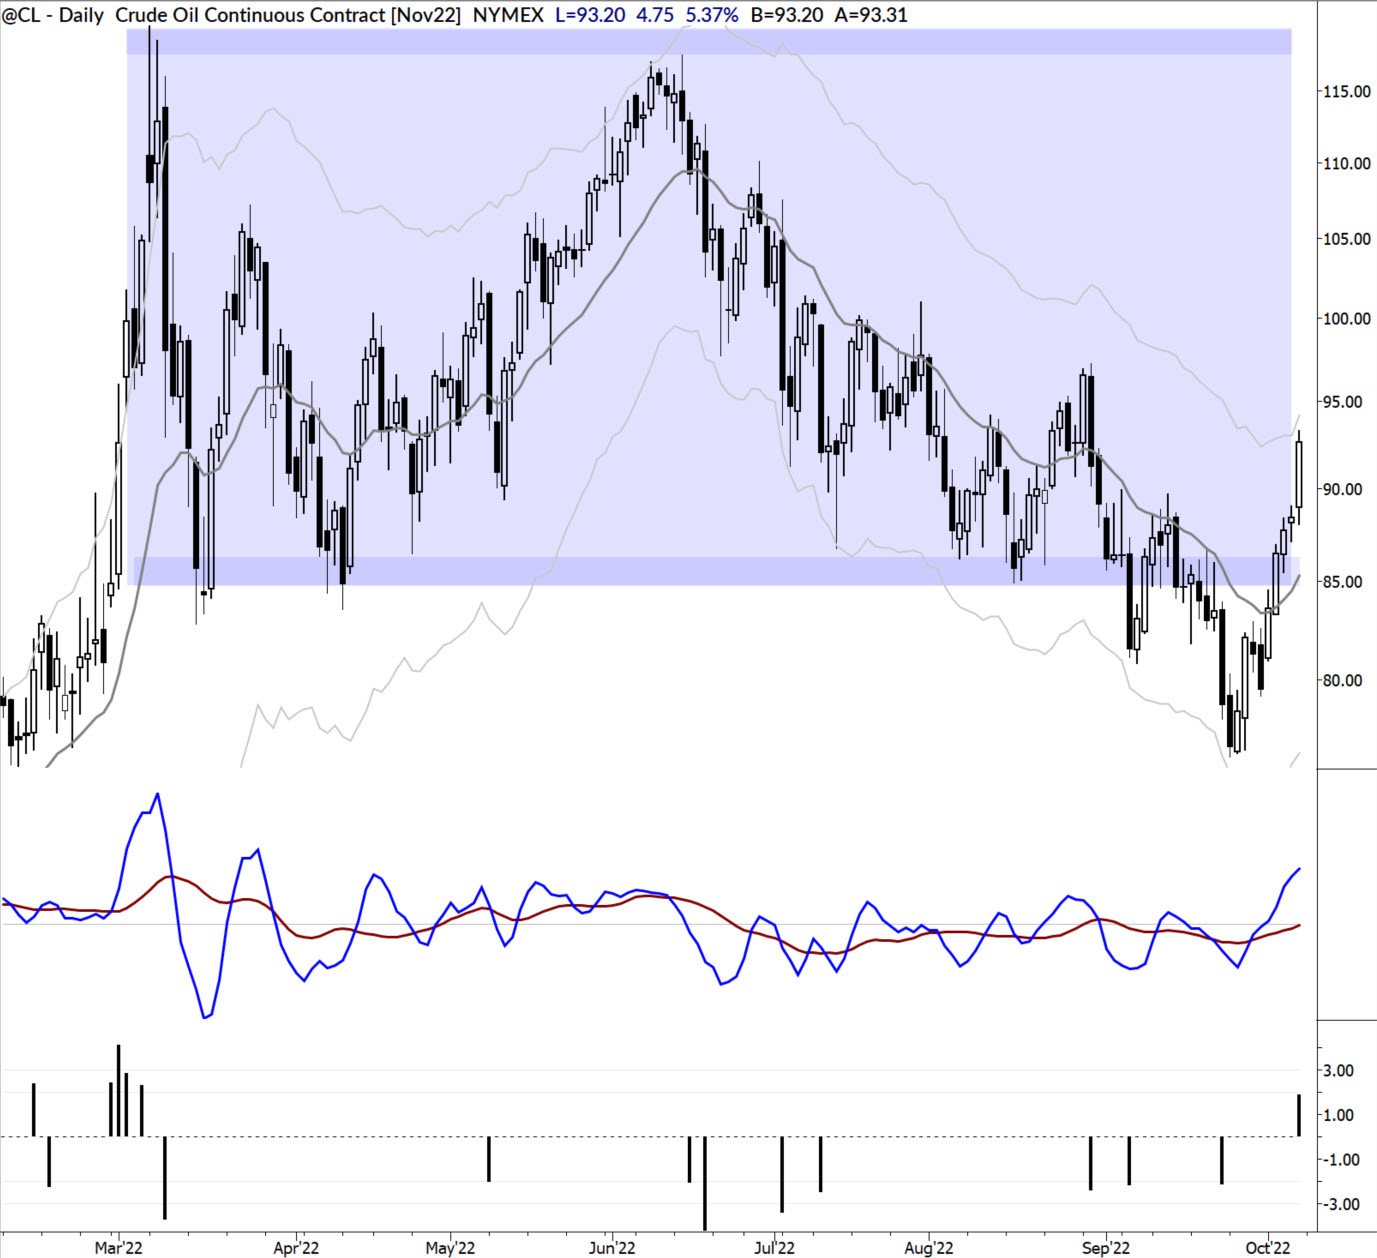
Second in the big picture, oil has recovered back above the bottom of the large range. We’ve been watching the range (see chart) for many months, and had watched as oil slipped below support. However, last week’s strength puts us solidly back in the range, possibly indicating a bigger-picture failure from the bears.

This is an important structural point, and strength above that reclaimed support clears the way for higher oil prices—and maybe for much higher prices. Typical action would see oil back above $100 bbl pretty easily, with a run toward $120 certainly within the realm of possibility. This is a major reversal of bias, as action just a week ago pointed to further weakness in oil. We don’t see a trade right now in oil, but are watching closely.
The week ahead (potentially market-moving data releases)
- Monday: none
- Tuesday: none
- Wednesday: PPI and Core PPI
- CPI, Jobs numbers, EIA Crude and NG numbers
- Retail Sales, Import & Export Prices


