Markets normally move in alternating waves of with-trend impulse moves interspersed with lower volatility pullbacks. This is a reliable trend pattern, and, in fact, is enough to base a trading plan on. Typically, a market will make a sharp move in one direction, will consolidate somewhere near the extreme of that move, and will set up another move in the same direction. But sometimes that pattern short circuits and something odd happens.
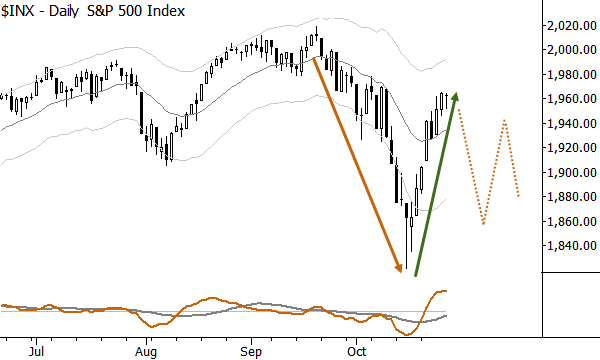
Sometimes, the sharp move leads to an almost equally sharp move in the other direction. There are two important lessons to take from this pattern:
- This is unusual. This is not how markets usually work. In the chart above, it probably points to a lot more hidden buying conviction than we might have expected.
- The baseline expectation following this pattern is volatility contraction: Look for markets to not make much headway in either direction, but to consolidate in a series of contracting swings. On a chart, this will likely be some type of rough triangle formation.
There are quite a few applications of this pattern. First, it can simply tell you to be very careful looking for with trend (in the chart above, downtrend) trades because that game is probably over. Second, options traders can make use of this pattern if they see it early. The “reaction” spike will often leave implieds at a very high level, meaning that it can be quite attractive to sell premium, with the right structure. Since you have identified a market that, statistically, is not likely to trend, there may be an extra edge in doing so. Third, this is a common pattern intraday, as well. Imagine you are watching a stock that has a strong opening drive, and you’re looking to get in after a pause. If that first reaction brings the stock all the way back to the open (or nearly so), it’s probably not going to be easy trading.
This is a simple pattern that can add depth and power to your market analysis. Though there is no directional edge here, simply knowing that difficult trading conditions are around the corner can let you modify your trading plan and avoid some losses.
Last thought: the chart above is of the S&P 500. Compare this current pattern to European and most Asian indexes. There might be another opportunity here…
looks like the run up is running out of juice at this moment, FED conference later.. so i’ll maybe wait for that and then go short, but kinda feel jumping the gun and do it now for extra profits, but it adds extra risk.
Jumped the gun and went short before the FED conference, EU markets down big today, SPY likely to follow, got a nearly perfect buy yesterday, now looking for a good exit in a couple of days.
I have started reading your book btw, I’m learning a ton of stuff! Still finding it hard to see the different patterns, but I have found that my broker has a good technical analysis tool I can use. Do indicators (moving avg, macd,..) help you a lot in finding and defining the course of a pattern? I haven’t reached that part yet, but I’m just curious.
I hope it’s okay I ask you my noobisch questions, just looking from some guidance in the markets.
I like this blog, but am amazed at many of the comments. Even the most basic of analysis shows that EVERY dip in equities is being bought (by central banks & companies engaging in massisve share buybacks). Exchanges even offer discounted rates for central banks buying equities. And people think stock indexes will fall??? Wake up people…