It's all in a day's work
I want to share a few observations on trading activity during the trading day. I will focus on the S&P 500 futures here, but may extend this (if there's interest) to look at a few currencies and maybe other commodities. The same general, broad concepts will apply to all markets: bursts of activity around the open and close, and relatively inactive midday. Let's dig a little deeper.
Measuring trend strength
Any measurement we apply to the market is at least a little bit arbitrary. This is one of the major problems of any kind of analysis: the market generates a flow of transactional data and quotes, and we have to filter and narrow down what we choose to look at. Any indicator or other measurement is another structure we impose on the data, so I prefer to do as little as possible. Simpler is often better.
A very simple measure of trend strength comes from a look at price bars. If the close is near the high (and the range of the bar is large), we can be reasonably sure that the market trended during that period. No, it's not quite that simple because we will often be misled, but "reading inside the bars" is a useful skill to develop. In general, bars like this probably show good trends:

Bars like this probably show a weaker trend or a trading range:

We can create a simple measure, the Close as Percent of Range (C%R) which is the close as a percentage of the bar's range: a bar closing in the middle would be 50%, while a bar closing on the high would be 100%. Yes, we are measuring one arbitrary point in time (the bar's close), and I'm not a fan of intraday systems that focus on the bars' closes, but this is a measure that probably averages out over time. We don't want the downtrends (0% = strong downtrend = closed on the low) to cancel out the uptrends, so if we just "flip" everything under 50% (i.e., 25% becomes 75%), we can average by time of day and get a trend strength measure.
Trend strength by time of day
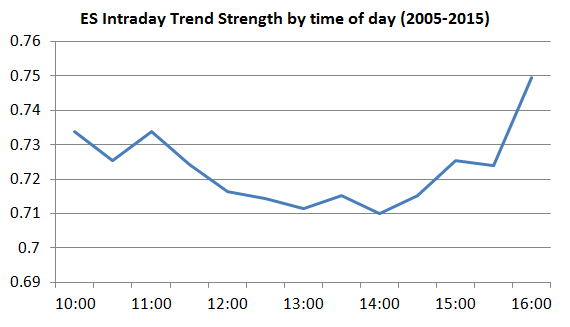
The S&P futures follow a pretty predictable pattern: they trend to trend well in the first hour and a half, trend less well into the ~14:00 time area, and then trend even more strongly into the close. This has clear implications for how you manage trades and what you, as an intraday trader, do: be aggressive with trend trades in the morning and afternoon, don't chop up money (most days) on trend trades mid-day, and do not fade a strong afternoon trend. A look at the data confirms these tendencies. (These charts are time stamped at the end of the period, so 10:00 is the half hour period from 9:30 - 10:00.)

Trading activity by time of day
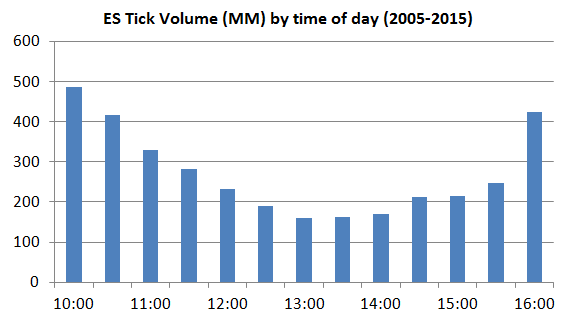
It's probably not surprising to see trading activity and volume follow the same intraday "smile". (Note that this measure is tick volume, not contract volume.) The same concept applies: active morning and afternoon, relatively dead intraday.

Conclusions
If you're an active trader, there are few surprises here. You knew all of this, at least intuitively, but maybe there are some refinements. You knew the morning and afternoon were the best trends, but did you know that the afternoon trends, on average, were that much stronger? Can you think about ways and filters we might use to find even better opportunities? Anyone can do this work, and it's important to update it periodically because the market does shift in some subtle ways. If your trading hits a rough spot, is it you or has something changed in the market? Comparing market stats like this in recent times to longer history can be a first step in answering that question.
For all traders, it is important to understand how the trading day unfolds and to think about how this affects your trading--what you do, and, even more critically, what you will not do. Timing, as they say, is everything.


