How to get started in technical analysis
This is the third in my series of blog posts for beginning traders. One of the questions I see over and over is “how do I start learning technical analysis?” Let’s talk about some of the pitfalls of the traditional paths, and how I think you might better get started.
Traditional Technical Analysis
Traditional technical analysis covers a huge range of tools, disciplines, and approaches. I would widen the scope even further and point out that a strict definition of technical analysis (making trades or forecasts based on information contained in price movements) also includes much of what we think of as quant work and machine learning. So, TA covers the full range from highly statistical machine learning to superstition based on “secret” patterns in the King James version of the Bible. Some of these approaches are probably more valid than others…
A traditional curriculum probably has the new trader jumping right into looking at chart patterns such as head and shoulders or cup and handle patterns. The standard text for this work is Technical Analysis of Stock Trends by Edwards and Magee (1948). This is a book that I think you should read, but read critically. One thing that most people forget is that neither of these authors were successful traders. Of course, that’s not a condemnation of the method, but it should be a caution.
In modern (post 1980) practice, much of the emphasis is on indicators such as stochastic, RSI, MACD, and others. Here, too, it’s important to understand the history: this work grew out of the early proliferation of personal computers. Think about it; at one time, calculating a daily moving average would have been a bit of a chore and doing it for 100 markets would have been nearly impossible. When personal computers became available, not only could we calculate moving averages, but we could do all kinds of other cool things like look at how much of the movement was up vs. down over a period, see how many of the bars close near highs, see where a closing price is in a lookback period, understand volatility different ways… the list goes on and on.
Reading the work from this period, we can see that people thought these powerful (for the day) analytical techniques would be the answer to profitable trading, but we know today that this is not the case. All indicators simply process OHLCV data and present it in a different format. No indicator offers a huge edge. New traders are often seduced by the patterns of indicators, but this work invariably ends in disappointment when results don’t follow.
Go the market
So what’s a better way? I think a lot can be learned from looking at price charts and being open to the experience. Take a look at the chart (which I randomly grabbed from my software for this blog) below:
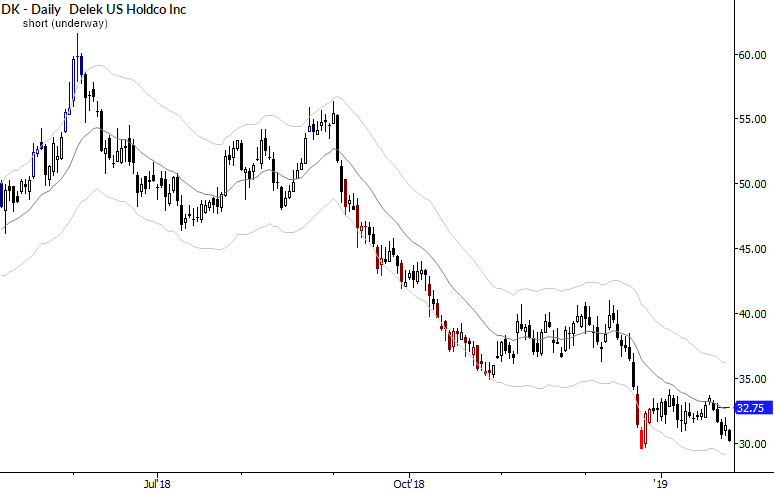
I would encourage you to keep the chart as clean (meaning as few indicators or other lines added) as possible, with one exception: some measure of “center” or average price is useful. On this chart, I have a 20 period exponential moving average, but the specifics are not important. Just put an intermediate-term moving average on the chart, probably something between 15 and 35 periods, and use any type of average (simple, exponential, etc.) you wish.
I also have bands (specifically, Keltner Channels set +/- 2.25 ATRs around the average) on my chart, but you don’t need those at first. The bands and average work together to show you if price is near a relaxed center or moving into a more extended zone. Eventually, you’ll likely want to use some type of band, but, at first, simply looking at “close” vs. “far” from the moving average will give you insight.
Then, simply spend some time looking at the chart. Think “locally”, in groups of 10-30 bars, and ask questions like this:
- Is price flat or moving to another level?
- Are the bars big or small, relative to the rest of the chart?
- Do bars change size a lot, or are they about the same size?
- Are there any areas where price seems to press against, but can’t get through?
- Any big surprises, such as large gaps or sudden moves on the chart?
- Do you see any patterns? (This one is a dangerous leading question…)
I know, for many of you, this is hopelessly elementary, or so you think. Even if you are an experienced trader, there’s value in returning to first principles and seeking the perspective of the beginner’s mind. Great value, but few have the patience for it.
If you are a beginner, this post is the answer to that oh-so-common question: how do I get started? Do this, for a few minutes at a time, with several charts each day. Stop when you feel fatigued or overwhelmed. Come back to the exercise several times each day, and revisit charts if you find yourself thinking about specific patterns and examples. Start comparing charts to other charts, and keep notes. This is how you begin to build your own vocabulary and perspective.
Of course, looking at a chart is just the very beginning of trading skill. In the next post in this series, I’ll talk about some other things you need to know.


