One of the themes I’ve written on recently is that we need to be careful how we think about trend change and end of trend patterns. I think too much of noise, particularly in social media, is focused on trying to take a position against a trend so that the person who called the trade can be a hero when the market later proves him right. In a world with enough people tweeting trades, there will be some standout results just due to chance, but it’s much harder to make money this way than you might think. There are better ways to trade than trying (now, December 2015) to buy crude oil and short stocks!
I’ve written about some of the reasons why trying to position against the trend can be harmful in other blog posts, but I just want to highlight two today. First, remember that a trend can end into a trading range. This is very common–we see a trending market stop trending and simply go flat. Second, if we do get the anticipated trend reversal, we can get in with higher confidence and make better trades once the new trend has made itself clear.
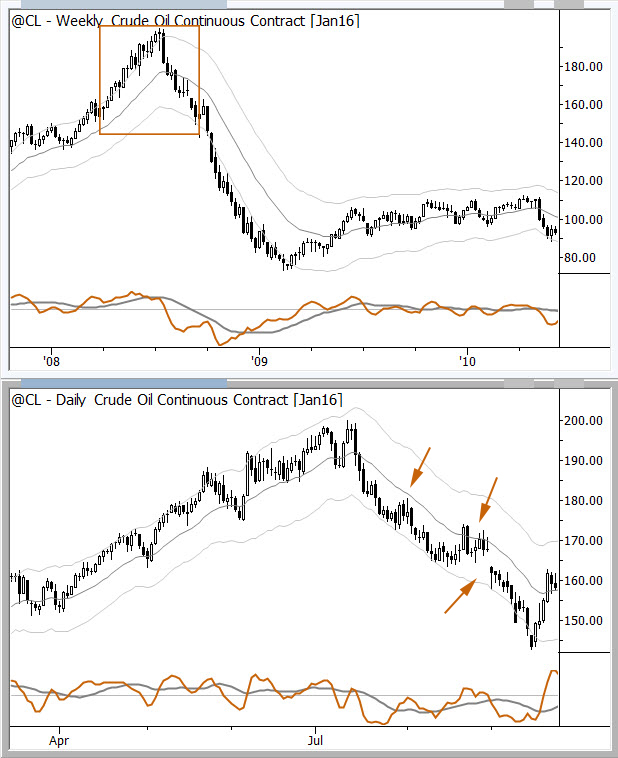
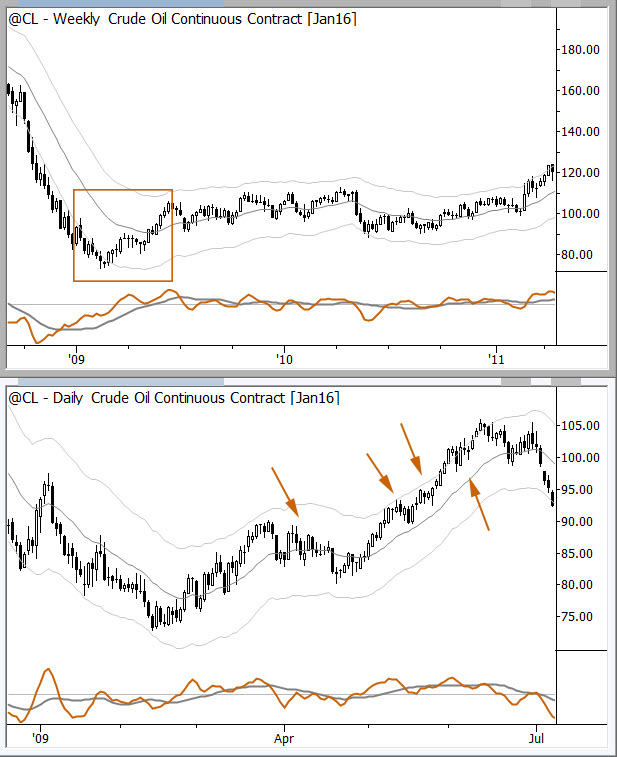
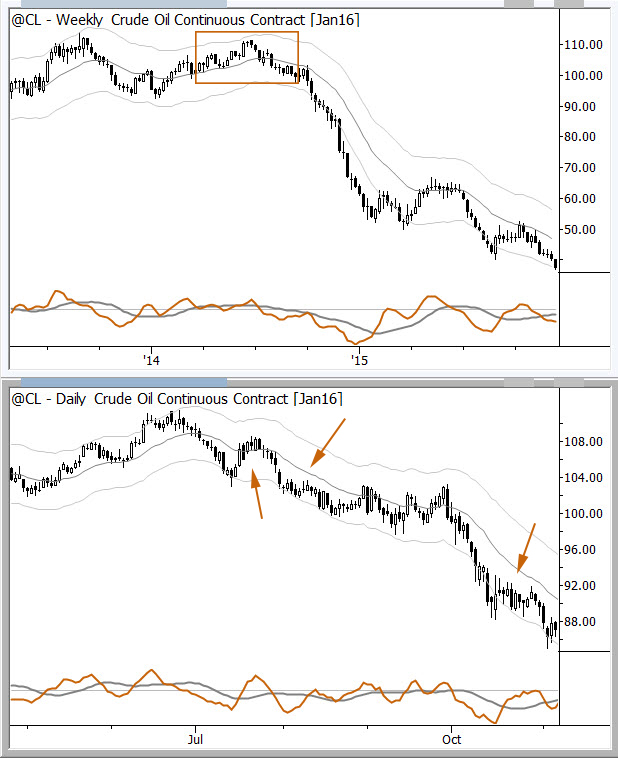
I don’t want to belabor either of these points today, but I do want to show you some chart examples so you can make the argument yourself. I’ve gone back through the last few years of crude oil prices (note that these are back-adjusted futures so the price levels are moved on older data, but the size and direction of the price movements are unchanged) and highlighted the points where the market made a major change of trend. I’ve done this on a weekly chart in the upper panel, and then shown simple continuation patterns in the daily chart below. Without drilling down into specifics of how you will find and trade these patterns, it is enough to
The lesson to take away from this is that trend change is a long process, and a good trend change will generate a strong trend in the other direction. This strong, new trend will set up tradable patterns itself, and we can trade those patterns with less frustration and higher confidence than we if we were always fading an existing trend. You don’t have to first, and you don’t have to be the hero. Sometimes the “boring” way to trade is the best (most reliable and most consistent) way to make money in a market.


Hi Adam, why was my comment not publish?
Where did you get 190 price for CL contract?
http://www.barchart.com/chart.php?sym=CLF16&t=BAR&size=M&v=2&g=1&p=MN&d=X&qb=1&style=technical&template=
I think it got spam filtered because of the link, but the answer lies in the back adjustment of the futures chart. As I said in the post, “(note that these are back-adjusted futures so the price levels are moved on older data, but the size and direction of the price movements are unchanged)”. Understanding the data/charts we are looking at is important. Back adjusted futures charts are standard, but historic price levels are all moved, in different ways according to the specific adjustment method.