How to draw trend lines
One of the complaints leveled against technical analysis is that tools are primarily visual and subjective, rather than being true analytical tools. There certainly is some truth to these complaints (and I have often been a critic of traditional technical analysis), but the best technicians work toward consistency and logic in their work. Let's think a bit about trendlines today.
It is possible to draw trendlines between any points on a chart, and they often "look pretty good". In fact, one of the issues I've had working with newer traders is that they will say "I drew this line and I like it. I can draw any line I want." Yes, of course you can, but the question is how do you draw a line that is meaningful and that will best respect the volatility and integrity of whatever trend might be in effect? That is a more difficult question. Let me share a few thoughts from The Art & Science of Technical Analysis

:
Standard uptrend lines are drawn between higher lows in an uptrend; the standard downtrend line is a line drawn between lower highs in a downtrend. The uptrend line shows where buyers have stepped in on the declines with additional demand and have bid the market higher, which is why Wyckoff called this line the demand line. In a downtrend, the downtrend line, or the supply line, shows where additional sellers have come into the market to arrest the bounces. If you are drawing standard trend lines, be certain of these points:
- They slope with the trend. Uptrend lines are upward sloping, and downtrend lines slope downward.
- Uptrend lines are underneath prices, marking areas of potential support. Downtrend lines are possible resistance areas, and must be drawn above
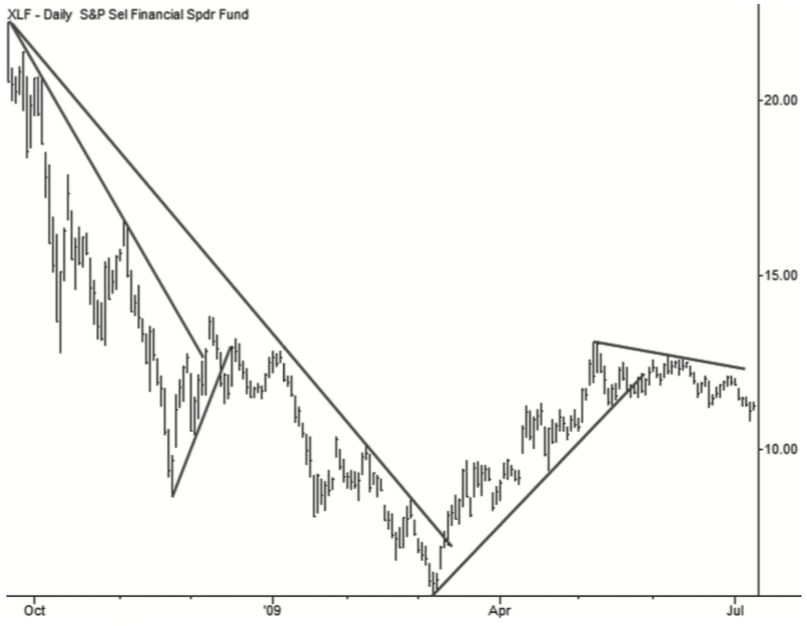
This chart shows examples of correctly drawn standard trend lines in the XLF.
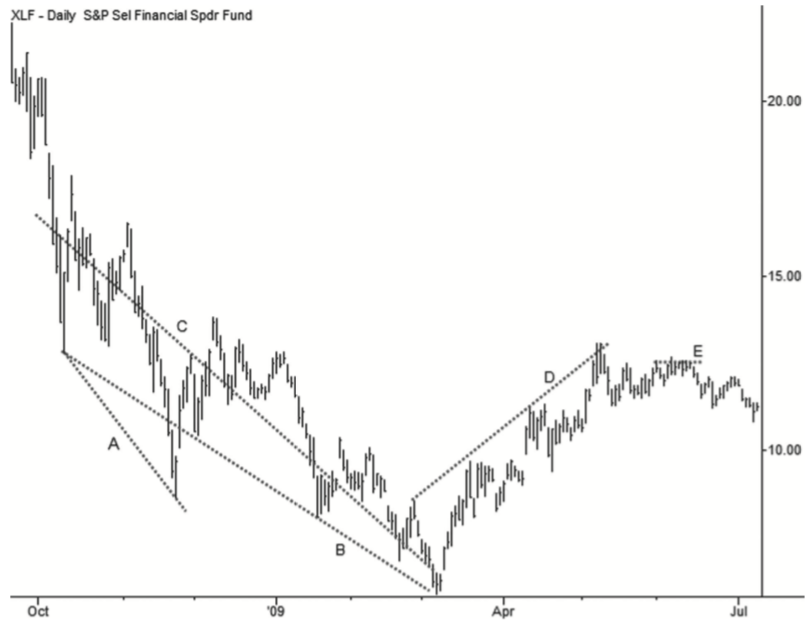
In contrast, the next chart shows examples of nonstandard trend lines:
- A is drawn between lows in a downtrend instead of between highs in a downtrend.
- B is also drawn between lows in a downtrend. Furthermore, it ignores a large price spike in an effort to fit the line to later data.
- C is more of a best-fit line drawn through the center of a price area. These may be drawn freehand or via a procedure like linear regression.
- D is drawn between highs in an uptrend.
- E raises a critical point about trend lines: They are lines drawn between successive swings in the market. If there are no swings, there should be no trend line. It would be hard to argue that the market was showing any swings at E, at least on this time frame. This trend line may be valid on a lower time frame, but it is nonstandard on this time frame.
In general, trend lines are tools to define the relationship between swings, and are a complement to the simple length of swing analysis. As such, one of the requirements for drawing trend lines is that there must actually be swings in the market. We see many cases where markets are flat, and it is possible to draw trend lines that touch the tops or bottoms of many consecutive price bars. With one important exception later in this chapter, these types of trend lines do not tend to be very significant. They are penetrated easily by the smallest motions in the market, and there is no reliable price action after the penetration. Avoid drawing these trend lines in flat markets with no definable swings.


