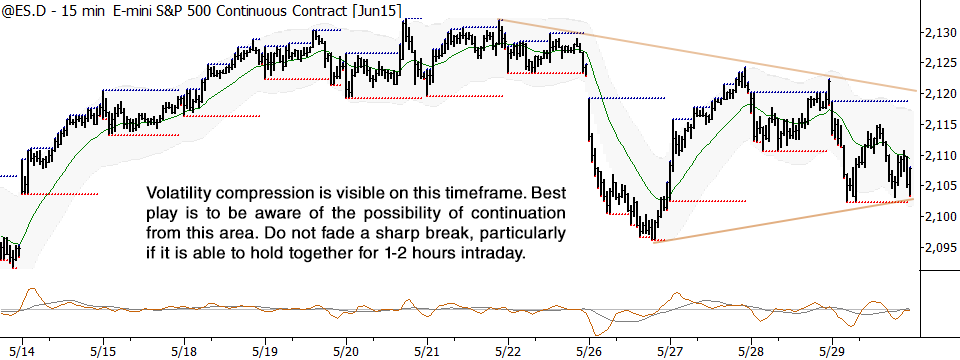
- Overall context is a broad consolidation, with volatility contraction visible on intraday charts as a triangle.
- Within this area (and expect wide, “messy” definitions of the confines of the pattern—not precise levels), expect failures and sharp spikes that are quickly reversed.
- Do not fade a breakout from this area, either up or down. Intraday, a break would probably look like a sharp thrust (perhaps on the open) that is able to consolidate without a significant pullback. This action likely sets up additional trend legs in the direction of that break.
- Longer-term direction points up, but be prepared to trade against this bias if dictated by the market.