[dc]I[/dc]n my previous post, I said that volatility compression was one pattern that could tilt the scales in favor of momentum being the dominant force in the near future. Another useful way to think about it (I think the terminology comes from Linda Raschke) is that a market is in “breakout mode” following a period of volatility compression. This means that the probabilities favor any sharp move leading to a further move in the same direction. Perhaps you want to trade with that move, but, at the very least, you don’t want to trade against it or fade it. This is all well and good, but remember that all any pattern can give us is a probabilistic “tilt”, a higher probability that one thing will happen than another; there will be many times that things do not develop as expected, and how will you handle them? How will you know you are wrong and what will you do about it? Let’s look at a recent example from the 30 Year Treasury Futures.

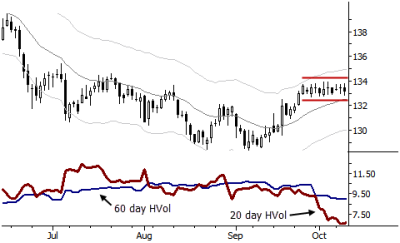
This is an example of a chart pattern that captures volatility compression. (Not all of these patterns can be seen on charts, but this one can.) A tight range following more typical swings is often indicative of volatility compression. Another way to measure this is with a short-term historical (statistical) volatility measure, or as a ratio of a short to longer term historical volatility. When we see this pattern, it is often difficult to say that the market is more likely to break to the upside or to the downside, but we know that there is an edge for continuation. We want to “go with” the market and short a breakdown or buy a breakout. (Note that the red lines are not drawn at actual levels, just roughly to highlight the range.)

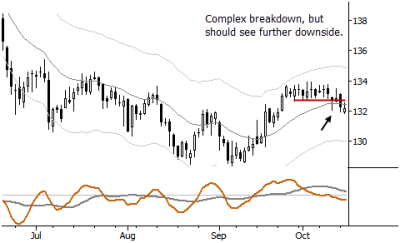
This chart shows the breakdown in progress. No, it is not clean and quick, and has some back and fill, but this is a reasonable spot to be short, or to at least have stopped out of any long positions.

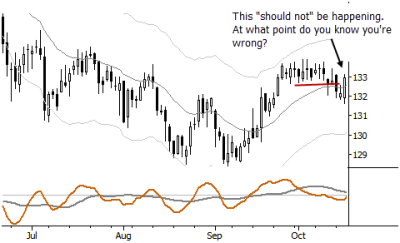
In my opinion, too many people spend too much time examining idealized examples of patterns that work as expected. It is far more important to know what “should not” happen, to understand what price action would contradict your setup or trade. In this case, we should not see a large upward closing bar that closes back in the range. This is ample evidence for the nimble trader to cover shorts, or, perhaps, to even buy with a stop under this day’s low. This is a case where your personality and desire for active (vs. passive) trading is important; not everyone would be comfortable being short and reversing to long on this day, and that is perfectly ok. What you don’t want to do is to stubbornly hold shorts against this pattern. If a good breakdown is underway, we should not see a large standard deviation up close, so this suggests our trade is wrong.

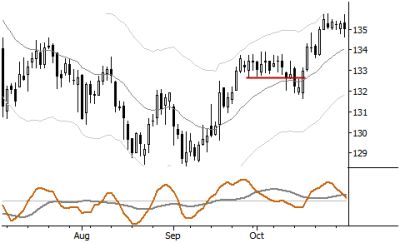
The market reverses off the lows, trades through the top of the range, and now appears to be consolidating for another push up. Technical trading is about understanding the statistical tendencies in the marketplace, and then managing trades as they develop. Though many skills (in addition to knowledge) are necessary and must be working together to trade profitably, one of the most important is this skill of monitoring the market for what “should not” happen and being very quick to step aside when the market gently (or not so gently) tells you that you are wrong.
Very true. All too many books, blogs, coaches,… only focus on what works, but hardly anybody shows/transmits all the not working trades in between, excluding easily 50% or more of trading reality (“Diary of a Commodity Trader” by Peter Brandt is a nice exception btw)
The problem I am usually facing in such type of range would be to find the right entry point. I have to trade EOD and always set stop orders above the range with an upper limit in order not to see too unfavorable executions, but the results I often get is either being sucked into a false BO or seeing the stock running away w/o getting executed.
Do you have a rule of thumb about the “ideal” duration of the range?
I’d probably have tried the doji which is the 7th candle in the range, as it seems to breakout. And if not that, then the day after the failure test in candle 12, then would have been stopped out any of the next 3 days.
When I saw that 2nd chart, I was saying to myself that I’d go long there. Surely enough there was a huge bull bar on the next chart. Great article.
Great to see you back with your postings, Adam! With your example, I wouldn’t be thinking of shorting based on higher time frame analysis (30y T-bond) on the weekly and even monthly chart, which you taught in your book.