[dc]R[/dc]eader Tom points out and asks about a possible attempted trend change in Cliffs Natural Resources (NYSE:CLF). This is a good pattern, and a good opportunity to discuss a few important points about trend change trades, in general.
First, we do have to be very careful in how we think about these trades. In my book, I made a point of calling them “trend termination” trades; this is perhaps not the catchiest phrase, but there is a reason: If we talk about (or think about) “trend reversal” trades then we risk being locked into the mindset that says “I found something going down. It looks like it’s set up for a trend reversal trade. Let’s buy it and if the trade will work it should go up.” It’s more correct to think “if I buy this for a trend termination trade what am I looking for? At least, the downtrend should stop. This means that it might go sideways or up. If it keeps going down, I’m wrong.” With a good number of these trades, we may enter, see prices go sideways for a while, and then the original trend continues. Though it’s a subtle shift, knowing that sideways fulfills the first level expectation of the trade can have an impact on how we manage these trades. “You were right. It went sideways, so let’s limit risk by tightening stops, maybe even get out if it shows signs of the trend continuing. It would be nice to make money, but at least the original trend stopped.”
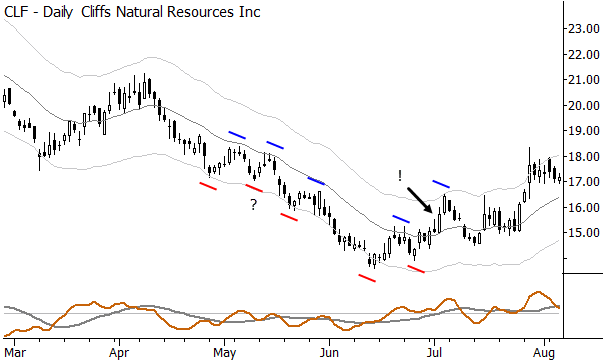
First, look at the chart above which shows the downtrend swing structure for part of the daily price history of CLF. Remember, in a downtrend, we should see lower lows and lower highs; to switch the trend to an uptrend we need a higher low and a higher high. Don’t be tricked at the point marked (?). Though this might be an equal or marginally higher low. We don’t have the higher high to point to a possible change of trend. This finally does happen at the point marked (!), and is the first place that swing structure points to trend change.
Now, I don’t think you can trade this structure as-is. (Perhaps it’s possible, but I’ve never personally known anyone to do it over the long term.) What it does is point out areas for us where buying and selling dynamics might have shifted, and alerting us to watch for possible changes.
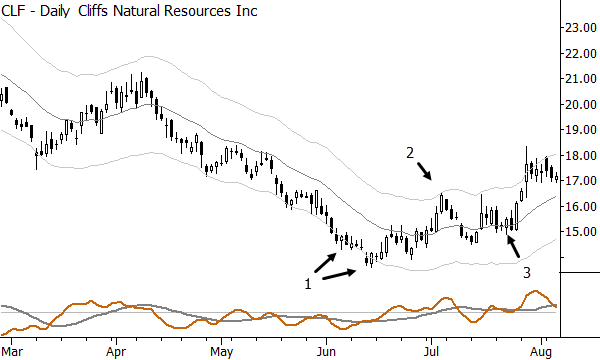
One of the keys to trading trend termination changes is to wait for some evidence that the trend has changed. Constantly fading a trend is painful, both psychologically and financially. In this case, CLF has given us signs that the trend might be shifting: 1) slight overextension beyond the bands, possibly indicative of a small selling climax (which often caps a trend, at least in the short term), 2) CLF touches the upper channel for the first time “in a long time”, and 3) long trades start working as consolidations break to the upside.
Is this justification for looking to buy in the current bull flag, or to enter upside breakouts? Probably so, but, of course, risk management is essential. There is also one more thing to consider:
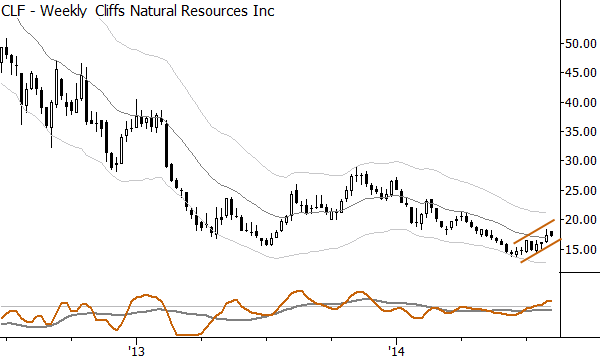
What do we see on the weekly chart? Something that looks a lot like an intact bear flag, though perhaps it hasn’t been set up with the best possible downthrust. Regardless, this is a reminder to not buy weakness in this name (that, by the way, knowing when to buy weakness (or short strength) and when not to, is probably enough of an edge to base a successful stock trading program on), and to simply exit if your stops are hit on the daily chart.
Last, some readers will wonder if it would be appropriate to flip to a short position based on the weekly chart if the daily long trade fails. Yes, that is possible, but we need to be careful. It is hard for many traders to switch horses and go from full long to full short, and it’s also possible to flip multiple times and incur significant losses. Though this can be done, as with everything else in trading, discipline and risk management are essential.


Pingback: Possible trend change in $CLF | Tom hansbury
Pingback: Things I found interesting this week… | Tom hansbury