[dc]W[/dc]hen markets trend, they do so in alternating waves of with-trend strength interspersed with countertrend pullbacks. Analysis of these swings can give many insights into the strength and integrity of a trend, and this can be done both quantitatively and qualitatively. Generally speaking, the with-trend legs need to be stronger than the countertrend pullbacks, and the stronger the with trend legs are, the better. However, excessive strength can indicate a climax extreme that can mark the end of a trend, or at least can cap that trend for quite some time. This problem—distinguishing “good” with-trend strength from “overheated” overextensions is one of the core problems of technical analysis. Many solutions have been proposed; all of them work at times and fail at others (one of the recurring problems is that these tools would often take a trader out of a trend too early), but this is another case where simple can be better. Though nothing works all the time, this is a case where a simple pattern can give important insight into the future direction of prices.
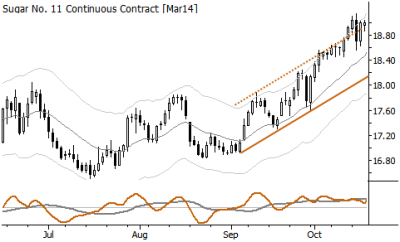
Let’s take a look at a recent example in Sugar futures. Many of the Softs (Sugar, Cotton, Orange Juice, Coffee, Cocoa, etc.) can be thin and can have some nasty surprises; inexperienced traders should be cautions, but Sugar tends to be a bit more tractable than some of the other Softs. The chart below shows Sugar was in a two month uptrend. Don’t get too caught up in how you define the trend, and we can have discussions about how to draw trendlines—the point is simple: Sugar was going up.

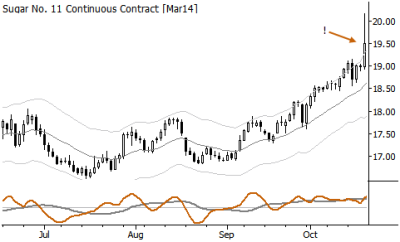
This was a reasonably strong trend, possibly threatening to reverse a multi-year downtrend. The next day, Sugar had a sharp spike higher.

There are several signs of a possible buying climax here. First, the range of this bar is many times the average range of recent bars. (It’s not necessary to quantify this, but, in general, a bar that has a range that is three or more times the average range of recent bars should catch your attention.) It also comes to a new trend extreme, and it is obvious that the pattern of the trend has been broken. It’s often enough to notice that something has changed, that something is different, and don’t assume that violations of the trend only matter if they are against the trend. (In other words, many traders would tend to watch for downward spikes as a warning that an uptrend is weakening. This is not wrong, but upward spikes can also be significant.) Long shadows on candles are often indicative of exhaustion. In this context, it might be ok to think that the large upward shadow (“wick”) on the last candle shows where many traders made mistakes.
So, what do we do now? If you’re long, you need to play defense. It is appropriate to tighten stops dramatically on long positions, perhaps even working them under the last 1-3 days’ lows. If you’re looking to short, it might make sense to aggressively pursue short entries following a pattern like this. At the very least, do not enter long positions immediately following a spike like this. Be careful of buying pullbacks or breakouts, and be very reluctant to buy weakness. A buying climax often indicates that the proverbial “last willing buyer” has bought, and the market will often collapse into the vacuum on the other side.

In this case, we can see that the buying climax marked the trend high, at least for several weeks. Generally speaking, if we get a strong enough selloff following a buying climax, the next bounce is often a good, high-probability short setup. It’s also possible that the market will pause for a while, absorb the overextension, and then head higher. It’s possible that a buying climax could lead to further spikes in the same direction; sugar could have traded to 23.00 on the next day following the “climax” (though the long shadow made that considerably less likely). Anything can happen. Nothing works all the time, and the best we can do is to quantify the probabilities and understand how the balance of buyers and sellers might be shifting in a market at any time, but this pattern, being aware of climax points, can offer great insight for traders in all markets and all timeframes.
I wonder if you should gain additional insight by switching to a HTF setting? You may see a resistance area around 19.50. When noticing such a strong push (even though it suggests climactic behaviour) I think about second entry short, but don’t see a clean way to put on the trade.
Adam, is there any information you derive from the Keltner Channel?
I guess you can always find a level somewhere, but I don’t see any level that I’d consider at all relevant here. Other things are driving price dynamics at this point I think (and I tried to outline those other things.) In this case, I also didn’t see a short entry, but it certainly was enough warning to tighten stops on longs… that’s a valuable piece of information too.
I do use the channels in a few ways. I have discussed in the book, in some posts, and will cover in detail in the course (sign up… it’s 100% free). The channels certainly did help here as this was a classic example of a climax above the channel.