A lot of the questions I get from people are about volatility–how to measure it, how to trade, and even, in a basic level, what it means. I recently added a section on volatility forecasting to the research I write for Waverly Advisors, and I thought it might be interesting to take a look at some ideas behind volatility forecasts, and I’ll share some exciting new directions for thought.
(Edit: my work is now available at Talon Advisors.)
What is volatility and how do we measure it?
These questions are not as easy to answer as we might think. Academically, volatility is often defined as the standard deviation of returns, usually annualized into a measure we call historical volatility. (I’ve written about how to calculate this measure here.) However, there are some problems with this measure–it might not tell the whole story. Since we’re looking at returns, this measure is blind to the highs and lows. it seems likely that, if we imagine two instruments that have the exact same closing price but with one that has much wider highs and lows for each day, the volatility and risk in those instruments is different. There are other measures of volatility, some complex, that do consider the range, and traditional technical analysis has long used Average True Range as a volatility measure. Also, we calculate volatility based on a time window, and this can lead to other distortions and blind spots. The value we see will depend on the widow we look at, sometimes with very dramatic differences. Takeaway message: there’s no one, right, way to measure volatility.
There is another measure of volatility to consider: implied volatility. For those of you who aren’t options traders, we basically reverse engineer this number out of options pricing models. Options prices depend on a number of factors: the relationship of the strike price of the option to the current price of the underlying, the time to expiration, interest rates, dividends (if any) or other costs of carry, and the volatility of the underlying. Everything in that list can be measured precisely at a point in time, except volatility. To calculate implied volatility, we take the options price we see in the market and work backwards through a pricing model to find what volatility number would give that price. There are, of course, issues here.
First, there are many different options models and they will give very different volatility levels. Also, we will see different levels of implieds for different expirations and strikes. (This leads to the well-known volatility surface.) If we want one number for implied volatility, which model do we use? Which strikes? Which expirations? Do we use some average of a range, do we impute delta strikes, or do we simply use an at the money implied? Again, no one right answer, but if we think of a model as a framework within which to view the world, we can find useful answers for our trading.
 Forecasting volatility
Of course, what we’d all like to know is what will happen in the future. For options traders, if we knew that volatility would increase or decrease over the time we held an option, it would be very easy to build profitable positions. Many options traders work with some intuitive forecast, and depend on the natural time and fear premiums built into options to give them profits. This will work, and perhaps work for a while, but the market is very nearly a fair game–these edges tend to even out over time and it’s not uncommon to see an options trader selling options for years without a losing month give it all back in single week. If we understand how volatility usually develops, we can do a little bit better.
The standard academic models for volatility forecasting are GARCH models. This stands for Generalized Autoregressive Conditional Heteroskedasticity, and is actually a family of models that may add or drop some letters. EGARCH, for instance, basically follows the same logic. Though this is a mouthful, the logic is actually pretty simple: Heteroskedasticity refers to the volatility of a time series (time series = simply a set of datapoints ordered in time. In this case, we’d be looking at returns (percent changes)), so let’s not use the big H-word anymore. Conditional means that the volatility of that time series depends on something, and the Autoregressive part means that the volatility depends on its own past volatility. In essence, what these models say is that volatility decays in a sort of ripple effect–imagine throwing a big rock in a pond. You get a big splash, then some big ripples, then the ripples slowly die away. This is how volatility is mostly modeled in the academic community.
There are literally thousands of variations of these models, but practical traders do no need academic curiosities–we need robust things that work. When people talk about volatility, one of the generalizations they make is that “volatility is trending in the short-term and mean-reverting in the long-term.” Let’s refine this a bit, and consider a few observations about volatility:
- Volatility, in any market, has a long-term average that appears to be meaningful. Volatility will tend to move toward that long-term average.
- (It is possible that the long-term average level of volatility changes due to trading activity or structural factors. It is probably a mistake to carry 1950’s-era stock market volatility into today’s analysis (but that’s an assumption you should check!))
- In the short-term, the best estimate for tomorrow’s volatility is today’s volatility. In the short-term, volatility tends to stay where it is.
- The volatility of volatility itself is positively correlated with the level of volatility. In other words, when volatility is already high, it is more likely to change a lot. When it’s low, it’s more likely to not change.
- In some markets, volatility develops asymmetrically with price direction. In stocks, volatility almost always increase much more as stocks decline than it would for the same magnitude of a rally.
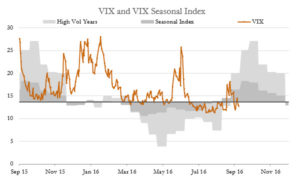
- In many markets, there is a much more pronounced seasonality effect in volatility than there is in price.
Putting those ideas together, we can build some powerful forecasting models that can give projected volatilities for different time periods, point us toward some potential profit opportunities, and help in our risk and trade management efforts. To a very real degree, the task of active trading is really the task of managing the impact of volatility. This is a lot easier if we understand volatility, and understand how it may change.
Pingback: The Week Ahead: Time To Look Past The Gloom? | 4financenews.com
Pingback: Dash of Insight| Weighing the Week Ahead: Time to Look Past the Gloom?
Pingback: Weighing the Week Ahead: Time to get past the gloom? – Minyanville.com – The Liberty Extra