When is a recovery not a recovery?
At the end of last week (week ended 11/9/18), many technical analysis were pointing to "recoveries" in Europe and Asian stock indexes. The observation was that most global stock indexes had rallied over the past two weeks and were holding above lows. Throw in some (incorrect) ideas about the end-of-year Santa Claus rally, and many people came into this week with a very bullish bias.
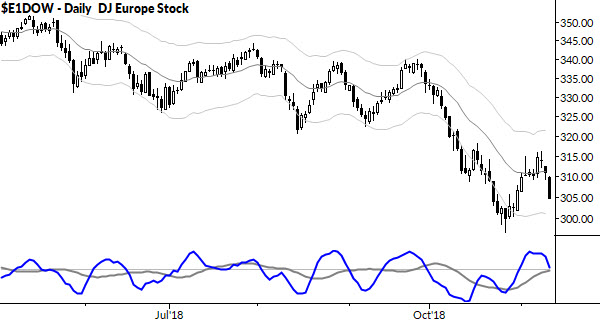
However, this bias rests on a mis-reading of simple chart patterns. See the chart below, which is a broad EU index:

The message here is very simple: this was only moderate strength, after a significant decline. Simply putting that rally in proportion to the previous decline would show that it is, clearly, not a recovery.
In fact, this is a classic bear flag pattern. We know bear flags have a strong downward bias, and that any breakdown from a bear flag can generate strong selling pressure.
There's a little more we can do with this. We know how bear flags fail, that they fail in three typical ways:
- by strong momentum against the flag
- by a failure at or around the previous low
- by going "flat" for an extended period of time as no downward momentum is generated.
Who would think that we could analyze the complex spiderweb of geopolitical influences and global economics on the macro scale with simple chart patterns? We can, and I've done it successfully for decades.
A simple rule of thumb here: it's hard to be bullish on global stocks in the short-term until we see touches of the upper Keltner channel. Those touches will almost certainly coincide with failures of bear flags and enough new upside momentum to generate some sustained buying. Until then... trade carefully.


