What is the Dominant Technical Factor?

When I discuss a chart or market, I often talk about the “dominant technical factor.” This is a useful concept that can help anyone, regardless of your experience level, to read a market better.
What is a dominant technical factor, how do you find it, and what can go wrong?
Why focus helps
Markets produce an almost overwhelming amount of information. Many active markets tick several times each second, and price movements are driven off of order flow in that market, derivatives, and related markets. New information (news) can hit the market at any time, with less-than-fully-predictable outcomes. People make trading decisions based on a complex web of factors, and emotion also plays a part.
If we tried to look at all of this, we’d quickly find ourselves in a “paralysis by analysis” situation—unable to do anything or even to understand what we’re looking at.
Focusing means we narrow our perspective to only look at what’s important, while eliminating noise and complications. If we could properly choose what to focus on, we’d always see what’s important.
Bad focus leads to bad results
However, we must be careful—if we pick the wrong things to focus on, we might be in trouble. What if, for instance, we didn’t know to focus on a company’s shifting competitive position in the industry if we were doing fundamental analysis? Or maybe, for another company, supply chain issues or debt structure are the most important?
For technical factors, many of the things we assume are significant don’t actually move markets or shape price action. (In other words, they don’t have an edge.) If we focus on those things, then we’re just focusing on noise.
So, it’s important not only to narrow our focus, but to narrow that focus down onto things that are truly important.
It’s also worth remembering that a big dose of humility is needed upfront: we won’t always be right! Sometimes, things we think are important are not important at all. Sometimes, what’s important changes quickly and we might be looking in the wrong direction. Despite doing our best, we will often be wrong and misled.
The goal is not to be perfect—the goal is to be better.
Finding the dominant technical factor
I do find that narrowing focus down to just a handful of things (or, in some cases, one thing) can give a solid perspective on any chart or market. With the above in mind, what do we focus on? Here are some examples of things I might find useful at different times:
- Volatility conditions, and whether there’s any reason to expect a shift in market regime in the near future. (E.g., a stock reporting earnings tomorrow…)
- Trend or range? Just glancing at a chart should give this information.
- Are we near any extremely significant levels? Examples might be all-time highs, or a very visible support or resistance level that has been tested multiple times.
- Any technical patterns that have a verifiable edge. (One of my favorites is a nested flag, or another type of consolidation in a trend.)
None of this is nearly as hard as it sounds. The patterns in my first book (pullback, anti, failure test, and breakouts) are a complete analytical toolkit—if you can read those patterns, you can read any market. Add a little common sense to that, and you’re most of the way to your destination.
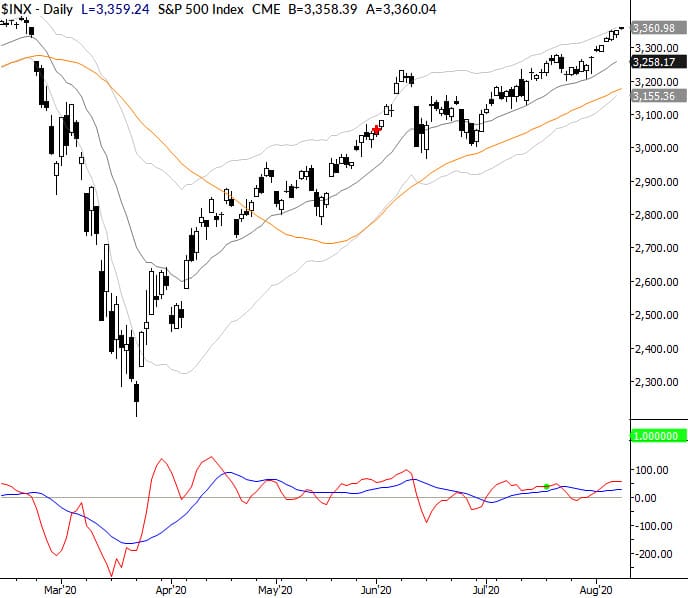
For example, consider the US stock market today (8/10/2020). I would identify the dominant technical factors in this market as:
- summertime volatility conditions (though we see a seasonal inflection for higher volatility in the next several weeks)
- the presence of all-time highs just overhead in the S&P 500.
Focusing on just those two factors has been enough to give you a gameplan for each day or week, depending on your trading style and timeframe.
Start doing this today
When you look at any chart, before you get into trades you might make or patterns you might see, ask yourself “what’s the most important thing to see here?” “What’s the dominant technical factor?”
You won’t always be right—no one is always right—but asking this question will solve many of the problems traders face!


