Markets move in alternating waves of with-trend strength (or weakness) interspersed with moves against the trend. We call these moves pullbacks or consolidations, and they create some of the most powerful and most useful trading patterns we have. (I’ve written about them here and here.) Many of the elaborate chart patterns people watch are really basically pullbacks; you can build a trading program based around this one, simple pattern.
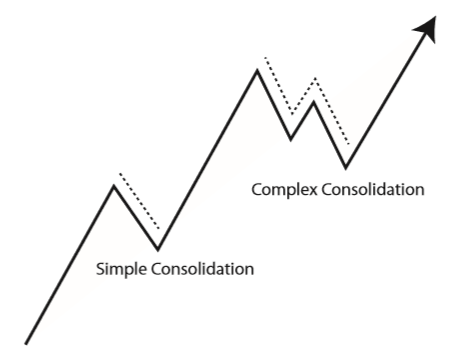
Of course, it’s not so simple as waiting for a market to make a move and then entering on a pullback. Though that plan might work (and does have a statistical edge), we can do a bit better than that. One of the complications of trading pullbacks is a pattern called a complex consolidation or complex pullback, in which the market makes an attempt to resume the trend, fails into a deeper pullback, and then resumes the original trend from a lower level. The following chart will make this clear:

Complex pullbacks can be frustrating because many traders are stopped out on the second pullback leg. Doubly frustrating because those traders can look at the chart and see that the trade would eventually have been a winning trade. Though it’s not always possible to avoid losses, there are some conditions that give us a higher probability of having a complex pullback than a simple pullback, and we can plan accordingly. Some of these are:
- Length of trend: longer trends are more likely to generate complex consolidations
- Strength of trend: pullbacks, in general, reset and “correct” trend overextension. A stronger trend can become more overextended, needing a longer and deeper pullback.
- Much-watched trends: markets tend to do whatever hurts the most people at one time. This is not just cynicism; it’s a reflection of the true nature of the market, which has evolved to take advantage of human emotions and mistakes. When everyone is watching and talking about a market, expect moves to be less clear.
Consider the current trend of the US Dollar in this context. Here’s the US Dollar index weekly chart:

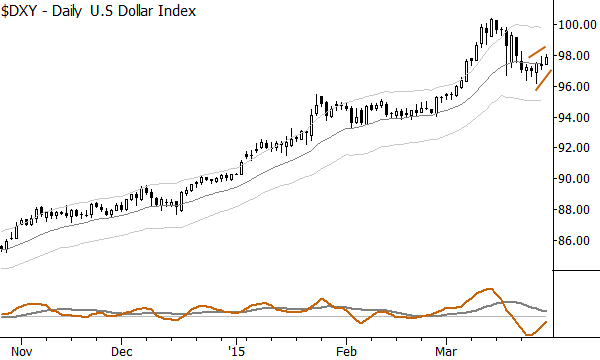
It’s pretty unusual to see a trend extend this far for so long, in essentially a straight line. In fact, I wrote a post about it a few weeks ago, and now the lesson is clear: once a pullback has begun, we can expect that pullback will likely have a “built-in fakeout”, and will quite likely be a complex consolidation. Though it’s not a firm prediction, we can predict a move into the low 90’s, based on market geometry, so that gives us some idea how the move might play out. The daily chart shows an interesting pattern, as well:

A market making a slow bounce like this can trick traders into entering long, with the long-term trend, but it’s also a good setup for another downswing–the “perfect storm” setup for a deep complex consolidation. How can we trade this? Well, that depends on your trading style. Be long if you wish, but know that you will likely need to reenter if stopped out. If you’re an aggressive short-term trader, you could look for a short into the second leg of the pullback, but the presence of the complex consolidation should affect how you manage this trade; you know your short is contra to the higher timeframe trend, so you know you need to use tight stops and be very proactive in taking profits. Another possibility, if you are looking to buy, is to do nothing until you see the second leg of the complex pullback in place, and, only then, looking for spots to buy the Dollar. Furthermore, we can consider the impact of this move on many related markets–other currencies, stocks, commodities, and interest rate sensitive products will feel the shocks of any surprise in the Dollar.
No pattern works all the time, but our work as traders, managers, analysts, and investors is to try to understand how the probabilities align in the market. What are the biggest risks? How is the market most likely to move? What is the high probability play? These are the types of questions we must ask (and can sometimes answer), and seeing the conditions for a complex consolidation set up can give us an edge in highly competitive and challenging markets.
Thanks for the post! Was wondering if you’d expect a Complex Consolidation to form in the chart of SWKS? Arguably the strongest stock in the market recently, SWKS is tricky because the reversal off the 50day is on solid volume but it would seem WAY too simple for the stock to hit new highs so soon, no? Just curious as to your thoughts/viewpoints.