TradeLab review
This blog post is a review of every TradeLab we have published for MarketLife since our previous post. TradeLab was designed to be an easily accessible and digestible "trading lesson" in context of a current setup in the market. We get to see patterns set up and play out, sometimes as expected, sometimes with some surprises.
I firmly believe that this set of trades alone makes MarketLife Plus (priced at less than a dollar a day!) the best value for the learning/developing swing trader... anywhere. It's such a great way to bridge the gap between "classroom" theory and what's actually happening in the market. With a little bit of trading skill, it shouldn't be hard to implement these patterns into your own trading system and style.
Each example below shows the original chart on the left, with an updated chart on the right. An arrow on the updated chart shows where the trade was published. Some of the original text and my updated comments appear below each example.
From the original note (edited):
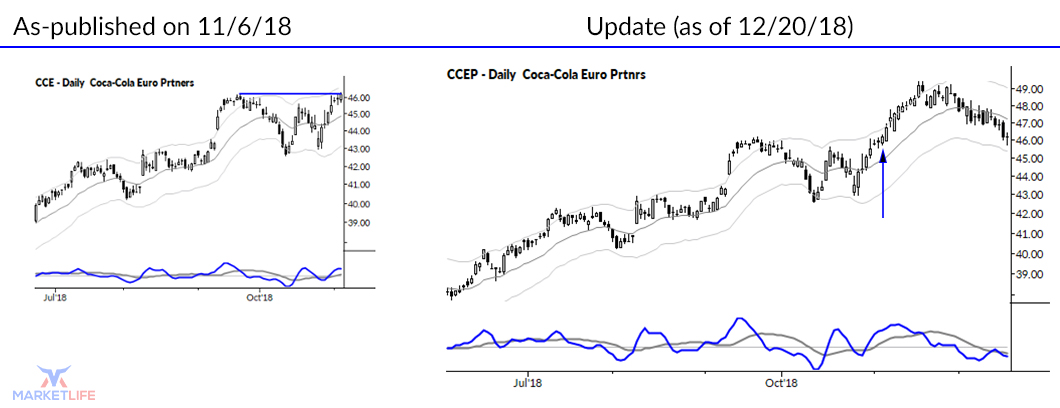
- NYSE:CCE (Coca-Cola European Partners plc) is setting up a breakout, with pressure against important longer term resistance.
- This has been a strongly trending stock, pressing to new 52 week highs despite the recent broad market weakness.
- (Note that broad market context is potentially bearish still...)
- One possible plan of execution is to buy a breakout beyond that resistance, with stops located in the 43.50 – 44.50 range.
- Look to take partial (or complete) profits at 1R and trail stop on the remainder.
Update:
Finding a stock that rallies while the market sells off (as it did here) is not easy to do. (Remember, we're not just picking the winners here. We're showing every TradeLab we've published!)
This, however, was a supremely good trade and a textbook example of how a breakout should work. The stock quickly and easily went to a 1R profit target after breaking above prior resistance.
An easy win.
From the original note (edited):
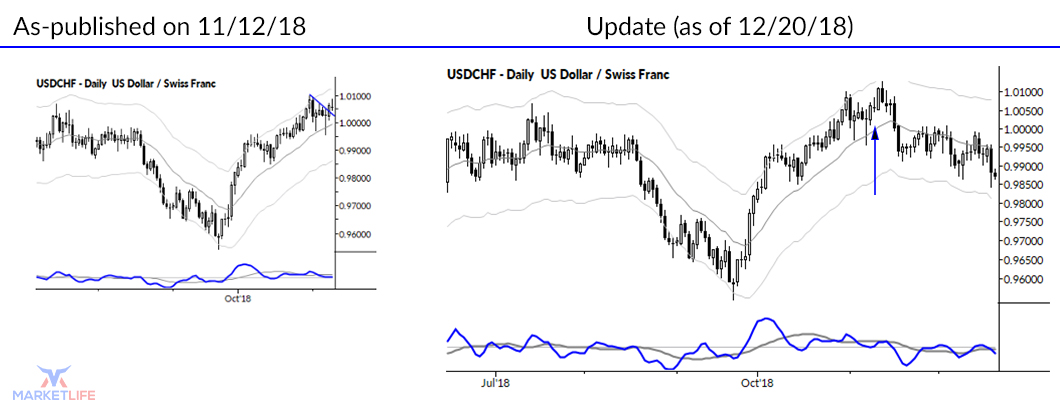
- Current price patterns suggest a bull flag on the daily chart. Look to enter on an upside break (ideally with strong momentum) above the pattern. Initial stops could be lo-cated around or below 1.0000.
- For trade management, take partial profits (or completely exit) at a 1R profit target. Look to aggressively trail stop to reduce risk. If triggered long, should see upside mo-mentum develop within a few sessions, otherwise work to limit risk and exit the trade.
- Currencies have not seen extended trends in recent months. Treat swing trades “move to move”.
Update:
This trade simply showed no followthrough. Trade entry occurred as the pattern broke to the upside, with good confirmation on the entry bar. However, the next bar showed a sharp reversal and suggested that all was not well with the trade.?
Price action like this is a warning to limit risk. My chosen method is usually to dramatically tighten the stop, but this is a part of your trading plan that needs to be clearly planned in advance.
In this case, a small loss (perhaps around -0.3R, to -0.5R, at most) was a reasonable outcome for this trade.
From the original note (edited):
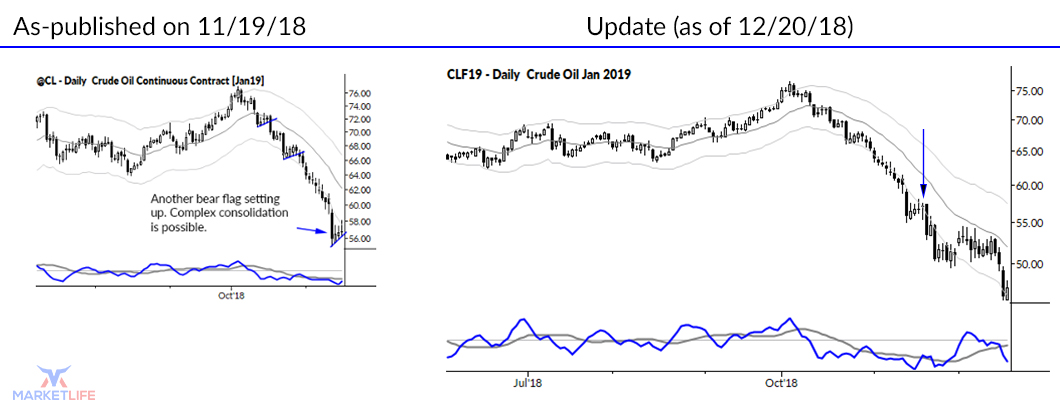
- Crude oil continues to break to new lows. The daily downtrend has now extended to touch the weekly Keltner channel.
- Last week’s consolidation gives a potential entry point for short swing trades, but we must also be mindful of potential overextension: if the first breakdown attempt fails, watch for a complex consolidation (two-legged pullback) to form.
- Best entry will be to enter on a breakdown (e.g., of trendline drawn under the consolidation). Use reasonably tight stops and look to trail stop aggressively to reduce risk in the trade. If entry occurs and is not confirmed with downward momentum in a few bars, look to reduce risk and/or exit the trade.
- Also consider taking partial profits at 1R. Doing so will reduce the “homerun” potential in the trade, but will also result in a smoother and more consistent equity curve.
- Trade could be executed in USO or via options, but not XLE, OIH, or an individual oil stock for this trade. Be clear that this is a trade in the underlying commodity and should be executed via the simplest possible vehicle.
Update
Well, it doesn't get much easier or clearer than this. The challenge for many traders would have been entering in what seemed to be an "oversold" or overextended trend. We've documented our thoughts on this market in real time elsewhere, but this looked like a strong setup, and it was.
This trade should have been an easy win.
From the original note (edited):
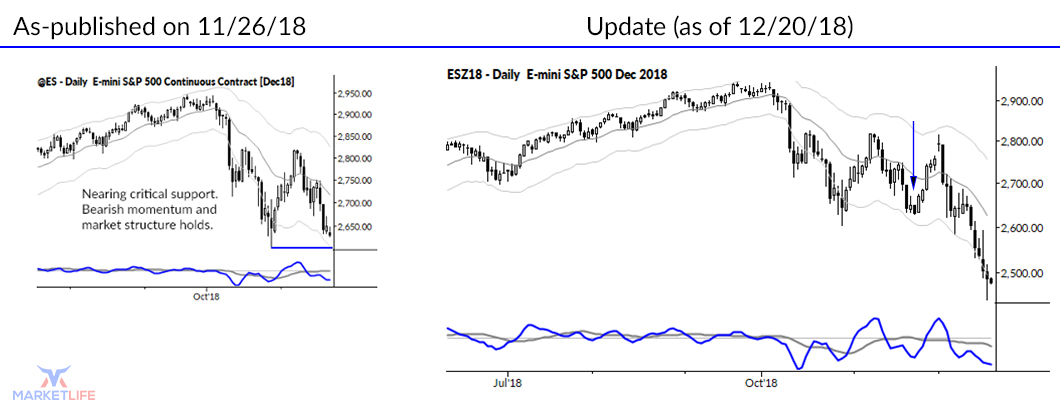
- This TradeLab covers more of a broad concept or idea, and that idea is: we want to be short the S&P 500. Global stocks are bearish, and the S&P 500 is pressing into im-portant support.
- Correct stops will be located roughly 50 S&P points (basis cash or futures) above the entry for daily swings. This seems like a wide stop, but…
- A number of options trades are possible: outright puts (buying -20 to -30 deltas, 1-2 months out provides a good balance of gamma/theta), verticals (which would benefit from skew), or ratios (better exposure to vega, but more costly due to skew) are all possibilities.
- Very strong upward momentum would contradict this trade, but it should be possible to minimize losses…
Update:
This was a more complicated trade, as we telegraphed in the notes: a "broad concept or idea". Now, one of the core ideas of swing trading is that you may have a setup, but you need a trigger to get into the trade. Right after we published the note, the market reversed to the upside, so there clearly was no entry near the lows.?
However, after a failure at the top of the range, pressure on support and a bear flag right above that support easily telegraphed a breakdown. A short in the S&P established on that trigger (or via options at any point before) would have profited handsomely from the breakdown below that support.?
In my daily videos for MarketLife Premium, we discuss every nuance of the market setup as it evolves, so there was a lot more information and context there, but, even so, this simple idea to look to get short indexes would have provided you a strong edge, or at least helped prevent the painful mistake of buying at that support when the market returned there.?
Another clear 1R win, but this required some work in tracking and monitoring the market for an entry.
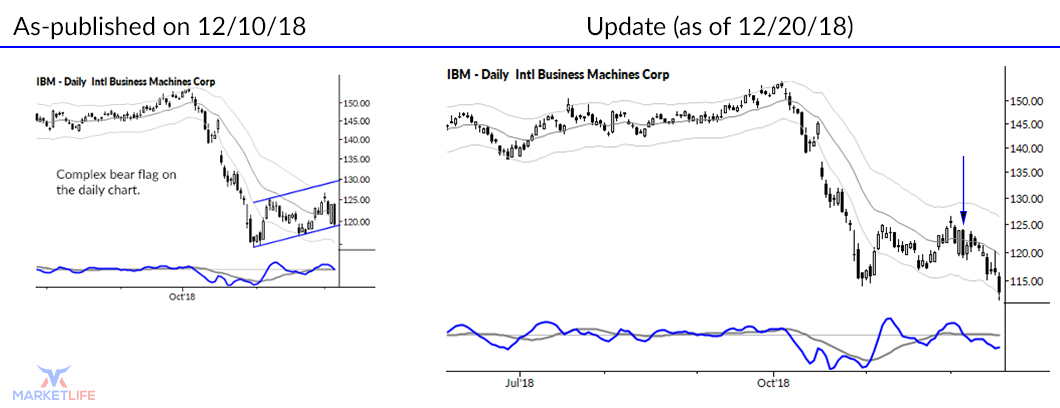
From the original note (edited):
- Stocks, in general, continue to be under stress, and we see potentially bearish patterns in most global stock indexes.
- We are focused on finding shorts in specific, individual names that show patterns suggesting further weakness.
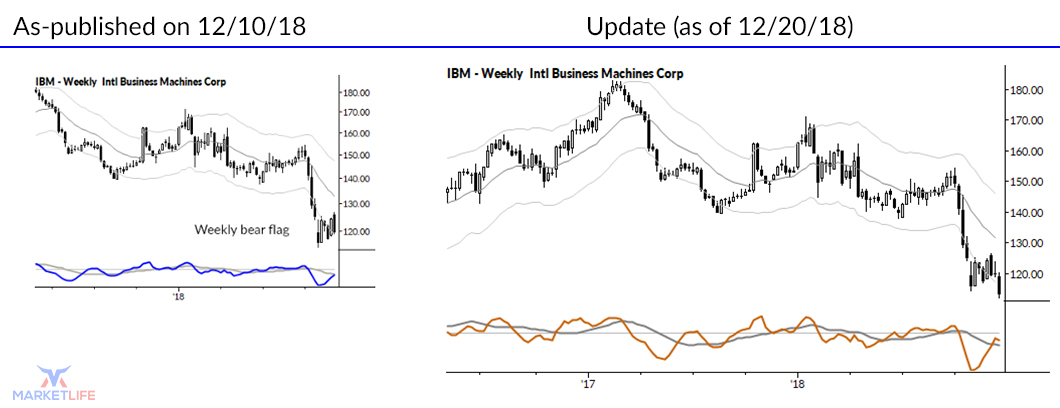
- IBM stands out as a particularly bearish pattern on the weekly timeframe.
- Swing traders can look to enter shorts on a breakdown. If trading on the weekly timeframe, stops of about 8 points are appropriate. (The setup can be traded on the daily timeframe, but there is higher timeframe potential.)
- It is also possible to structure option trades here: consider put verticals (example: 120/100 long/short puts for Jan expiration). Volatility is high enough that simple long puts may not be attractive, and skew works against put ratio spreads.
- Look to manage the trade actively, taking at least partial profits at 1R.
Update
We may be a little early with this review, but that's ok; the train has left the station. I've shown you both the daily and weekly chart above so you can see what a clean breakdown from the weekly pattern looked like.?
The daily chart is more complex, but still very well set up with a shorter-term breakdown. Another easy, 1R win.
These trades are part of our MarketLife Plus service.
What does it cost you to get trades like this?
Less than a dollar a day.
We priced this tier of our service to be accessible to everyone, as a service to the developing trader who maybe has a small account but still needs reliable lessons drawn from current market action (and, oh, the occasional opportunity to make a good trade or two!) Check it out. We have a no-risk, no-obligation trial, an ironclad “more than 100% moneyback guarantee”, and I stand behind everything we produce.
Come and see why we’re different.
Join the MarketLife family today.


