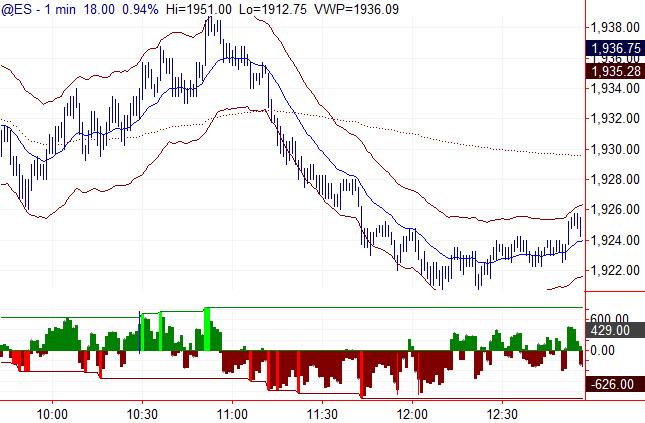
I received a good question from Brent:
I recently watched [a presentation someone else did] about VWAP and they seemed really convinced it was an effective indicator. I am curious if you have studied VWAP in recent years? Their contention is the black boxes key around VWAP which makes it very useful. I know you said you could not find an edge with volume, but was curious if you have examined this since all the program trading has ramped up…
Well, the short answer is yes I’ve looked at it, and no I haven’t found an edge. But I think that answer deserves a little more qualification and explanation.
First, let me explain my thinking in testing moving averages. Basically what I’m looking for when testing any level is some evidence (or even suggestion) that price movement is somehow “non random” following price engaging the moving average. You could start, for instance, with recording all times price touches a moving average, looking at returns following those points and comparing it to all market action. Of course, we need to make some decisions; price coming into a moving average from above is probably different than price coming from below, a moving average breaking might be different than it holding, etc. We soon realize that this isn’t quite as black and white as it might seem, because then we ask things like “is it different if price comes to the moving average from far away or if it slowly ‘edges’ into the average? What if the market is trending?”
The questions can go on, and each time we cut the data a different way we are degrading the test a little bit. In most of my work, I’ve tried to stick to higher level questions and simply looked for some evidence that there is something interesting happening around moving averages. I cannot find that evidence, nor can I find it in any calculated level like Fibonaccis.
When I’ve looked at VWAP on different timeframes, I find it’s no different than any other average, which is to say that price action following price engagement the moving average is random and unpredictable. Someone selling you something based on VWAP is going to give you many arguments why it should work or why it should be so, but ask them for statistical evidence. We always hear why a level should work (or how it reflects the structure of the Universe or something else), but the people selling these things, oddly enough, never seem to have done the work to show whether it is true or not. Don’t be dazzled by marketing pitches for technical concepts.
Considering further, I find I don’t need these levels to trade well, and I also know that humans are susceptible to a number of cognitive biases that might make lines on a chart look important when they are simply random. So, my personal answer, based on deep quantitative work and my trading style, is that I think these levels are meaningless and that people using them are deceiving themselves. I ignore them and ignore any commentary based on them.
Is that the last word on the subject? Of course not. Anecdotally, I know many traders that use VWAP, but I also know many that use moon cycles or calculations based off the Jewish calendar. Me? I’m a cranky nihilist and something has to meet a pretty severe standard of proof before I’ll use it, but that’s just my answer. The rest of your question (which I edited) suggests that you’re on track to do these tests yourself, and I think that’s where most people find answers. As one of my mentors used to say, when you have a question, ask the data. Ask the data.
Was there a link to the original talk?
No, there was not.
When you have a question – ask the data = PRICELESS.
yeah… a small thing, but it’s really shaped the way I think. I can remember him laying out arguments and questions, and then gently saying “let’s ask the data…” as we began to do analysis. It’s a good way to think.
Hi Adam, one question specific to moving averages. I concede the point that in most liquid asset classes, moving averages do not provide an edge. However in some cases (particularly emerging markets), moving averages do provide an edge and you can build a system off MA-crossovers.
My question is, would you accept such evidence (working in one market / sector, not working in another ) and trade using moving averages in markets where the evidence is favorable? Or would you reject anything that doesn’t show at least a slight edge across markets and time periods?
Difficult question with no firm answer, and I’d expand it a bit to make it even harder to answer–we see many things work through some time periods and fail in others. Your EM example… I’m assuming that is recent? Yes, anything will work (more or less) in a trending market.
In general, I’d like to see some universal application and stability, but we also do need to be aware that asset classes have different characteristics. In fact, that was the topic of a post I just wrote today: https://adamhgrimes.com/no-its-not-all-the-same/
So the system of MA-crossover I have is based on end-of-day data on Indian equities, with intraday stops and triggers (maybe there is still untapped momentum in that timeframe) and hence the moving average provides an edge, as opposed to longer term holding periods). I’ve tested it over the last 10 years of data with out-of-samples, etc and it seems to work fine. On this time frame, I think I’ve seen a lot of choppiness, so I feel comfortable there.
The moment I do a stability test by moving to S&P, or Eurostoxx etc, I see the edge disappear. One explanation I have is that the edge in this time frame is probably captured best by machine trading, and maybe that has not yet taken off in India to the extent it has in developed markets. Maybe the market just isn’t deep enough yet for several automated trading systems to come in – I don’t know!
Your comparison with time periods makes it easier to think about, though. And the answer is quite simple too, if the edge doesn’t endure anymore, then the system isn’t valid anymore. I have to think about how to apply that to geographical disparity however – maybe keep testing the validity of the edge and drop it once it stops being valid?
To some extent, monitoring your (or the system’s) performance for stability is at least part of the answer, and maybe a very big part of that answer. It’s not uncommon to see systems like this work for many years, and then stop working. Of course, they also frequently have multi-year drawdowns, so it really becomes a matter of trying to separate out the normal drawdown from “something else”…. there’s no way to do this with 100% certainty, and that is simply one of the risks we must assume when we work with any system.
Moving averages are stupid. Who institutionally bases trades on moving averages?
Who institutionally even uses a chart? Hardly anyone! The whole point of being a trader is following the big money. That is, if you’re a prop or hedge fund trader of course, then you’re on a team doing some crazy game theory stuff to figure out how to beat other funds in a multidimensional chess match.
VWAP IS useful if you know how to use it and what it means and how the market moves.
I suggest market auction theory. Also you’re VWAP isn’t a consistent time frame. Markets ARE random because anyone can come and go as they please, and we all have our own goals. Perhaps johnny retail trades for alpha, and Mr institution is giving a IB a particular price so they need to move a large number of shares with an ‘at least’ average price on their position, at the same time not tipping off the market of their large position taking.
You have to figure out what ‘events’ are in the market. Events can be anything. Large orders, pulled orders, icebergs, a breakout from a range. Look at VWAPs from swing highs to swing lows… VWAP in ranges, the mean reversion when channeling… when trending you see a hell of a lot of support/resistance against the 1st std dev on the trend side, and once you’ve hit the 2nd std dev against the trend you know the market is changing. Think about market auction theory… places with higher volume is where both buyers and sellers think they can make money.. in order for VWAP to keep moving, it has to keep putting in more and more volume in that particular “event” like a swing high to swing low.
The beauty of VWAP is though the std dev and other cumulative values, it’s like having a risk metric built in. I can get on my Matlab and write a script that looks for say, when the 2nd std dev is hit in a range, and then asks the question ‘what price is hit next-first from this point on, the price level of the current vwap, or the current location of the 3rd std deviation’ … that is an easy example showing a 2/1 reward to risk. Besides, all you even need at that point is a mean reversion of what, 40% of the time, and not risking more than 2% of your account on any one trade, your risk of ruin is practically nothing, and you have a positive trade expectancy.
Think about the competition though, how does the market work, the microstructure. Are there darkpools? Example in the ES futures, there are no dark pools, and there are a LOT of institutional algos running. Math is predictable….. and we have machine learning that adjusts our models to the current market environment. =D
Pingback: Fungerar VWAP? | SAMUELSSONS RAPPORT