Impulse Moves and Market Patterns: A Real-Time S&P 500 Example
Were you caught off guard last week? Did you expect the market to do something it didn’t do? One of the most reliable, recurring market patterns is the concept that sharp impulse moves followed by a quiet period usually lead to another move in the same direction. Recent action in major US stock indexes gives us a beautiful example of this pattern.
Real-Time: the key to real learning
I want to emphasize that this example comes from real-time analysis. This is not a case where we find a nice example (that worked, of course) and cherry pick it for a blog post! No—we identified this pattern in real time, before it happened.
Over the past decade of teaching and training traders, I’ve realized that there is significant value in carefully chosen examples. Any chosen examples are probably always going to be optimistic and will show the best possible pattern resolutions. We need these to train pattern recognition, but it’s not enough.
You must put it into practice and see it play out in real time. There’s no other way to really learn.
Incredible learning comes from seeing patterns as they set up and resolve—for better or worse. You’ll learn just as much from the ugly failures as from the easy successes.
The most powerful trading pattern
If I could pick one trading superpower, it would be a complete understanding of impulse moves and their resolutions. An impulse move is simply a sharp move in one direction. There are many tools for finding and tracking such moves, and even an intuitive read of charts can be useful.
The really interesting stuff happens after that move is completed. There are, broadly speaking, two possibilities:
- The market snaps back sharply against that impulse move. This is mean reversion. This offers opportunities for trading against the big move and also suggests there is not likely to be another move in the same direction as the impulse move soon.
- The market may pause somewhere near the extreme of the impulse move or move back a little against it—what I call a “reluctant pullback”. The exact details aren’t significant—what matters is that mean reversion is muted. When this happens, we have a powerful setup for another move in the direction of the impulse move.
I’ve certainly written about this pattern before. It drives most of the other patterns people trade. In some sense, it’s the underlying truth of how prices move in response to human emotions.
And we saw a crystal clear example of this pattern play out in the S&P 500 index, a pattern that was easily identifiable in advance and which offered an easy profit for nimble traders.
The pattern in stock indexes (July 2024)
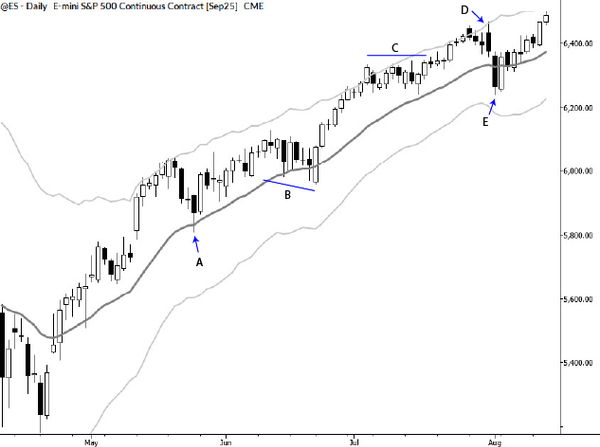
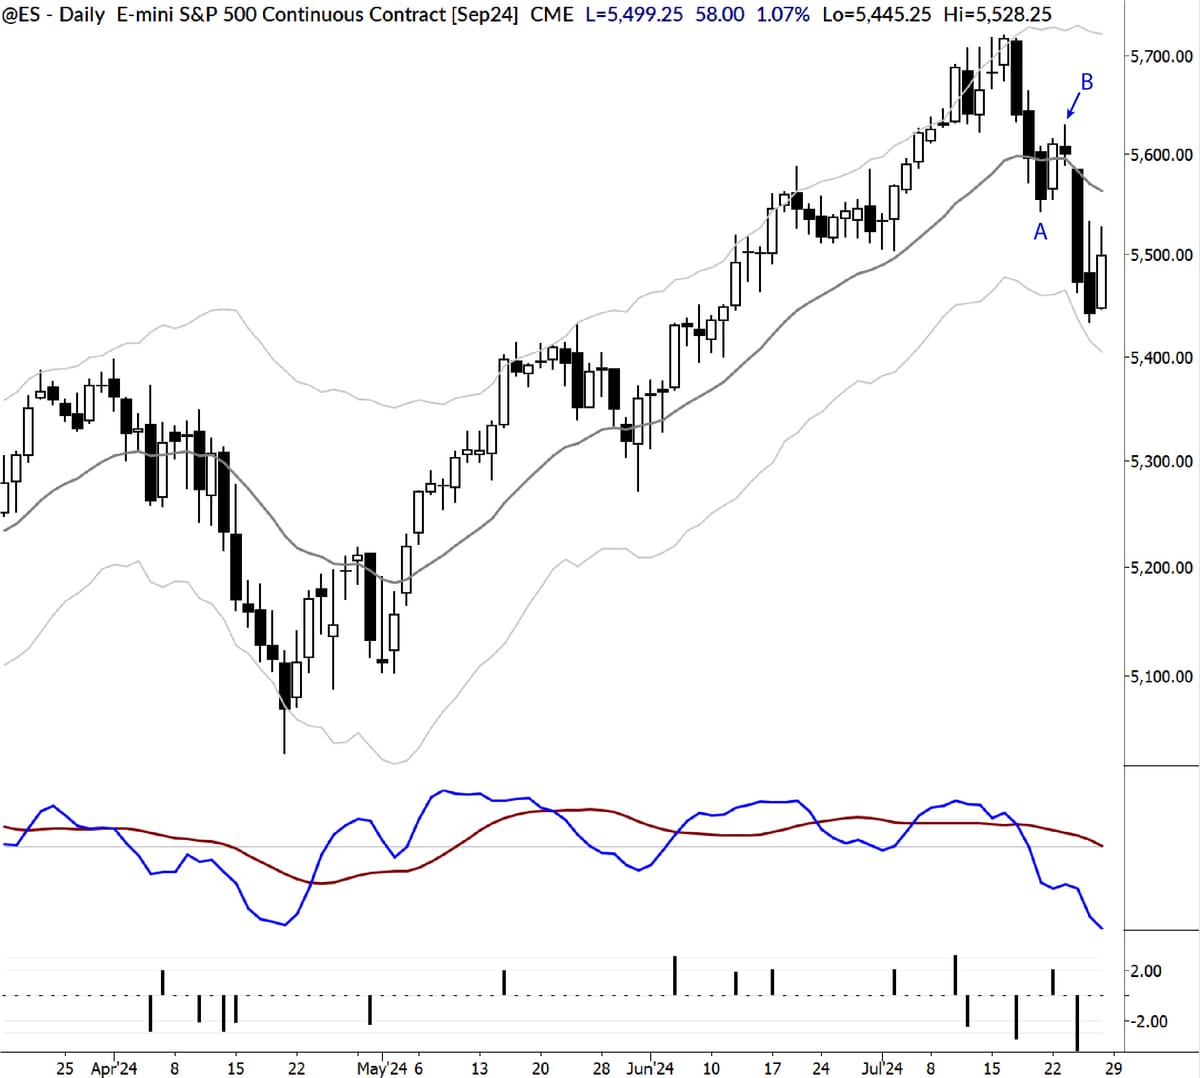
Take a look at the chart below.
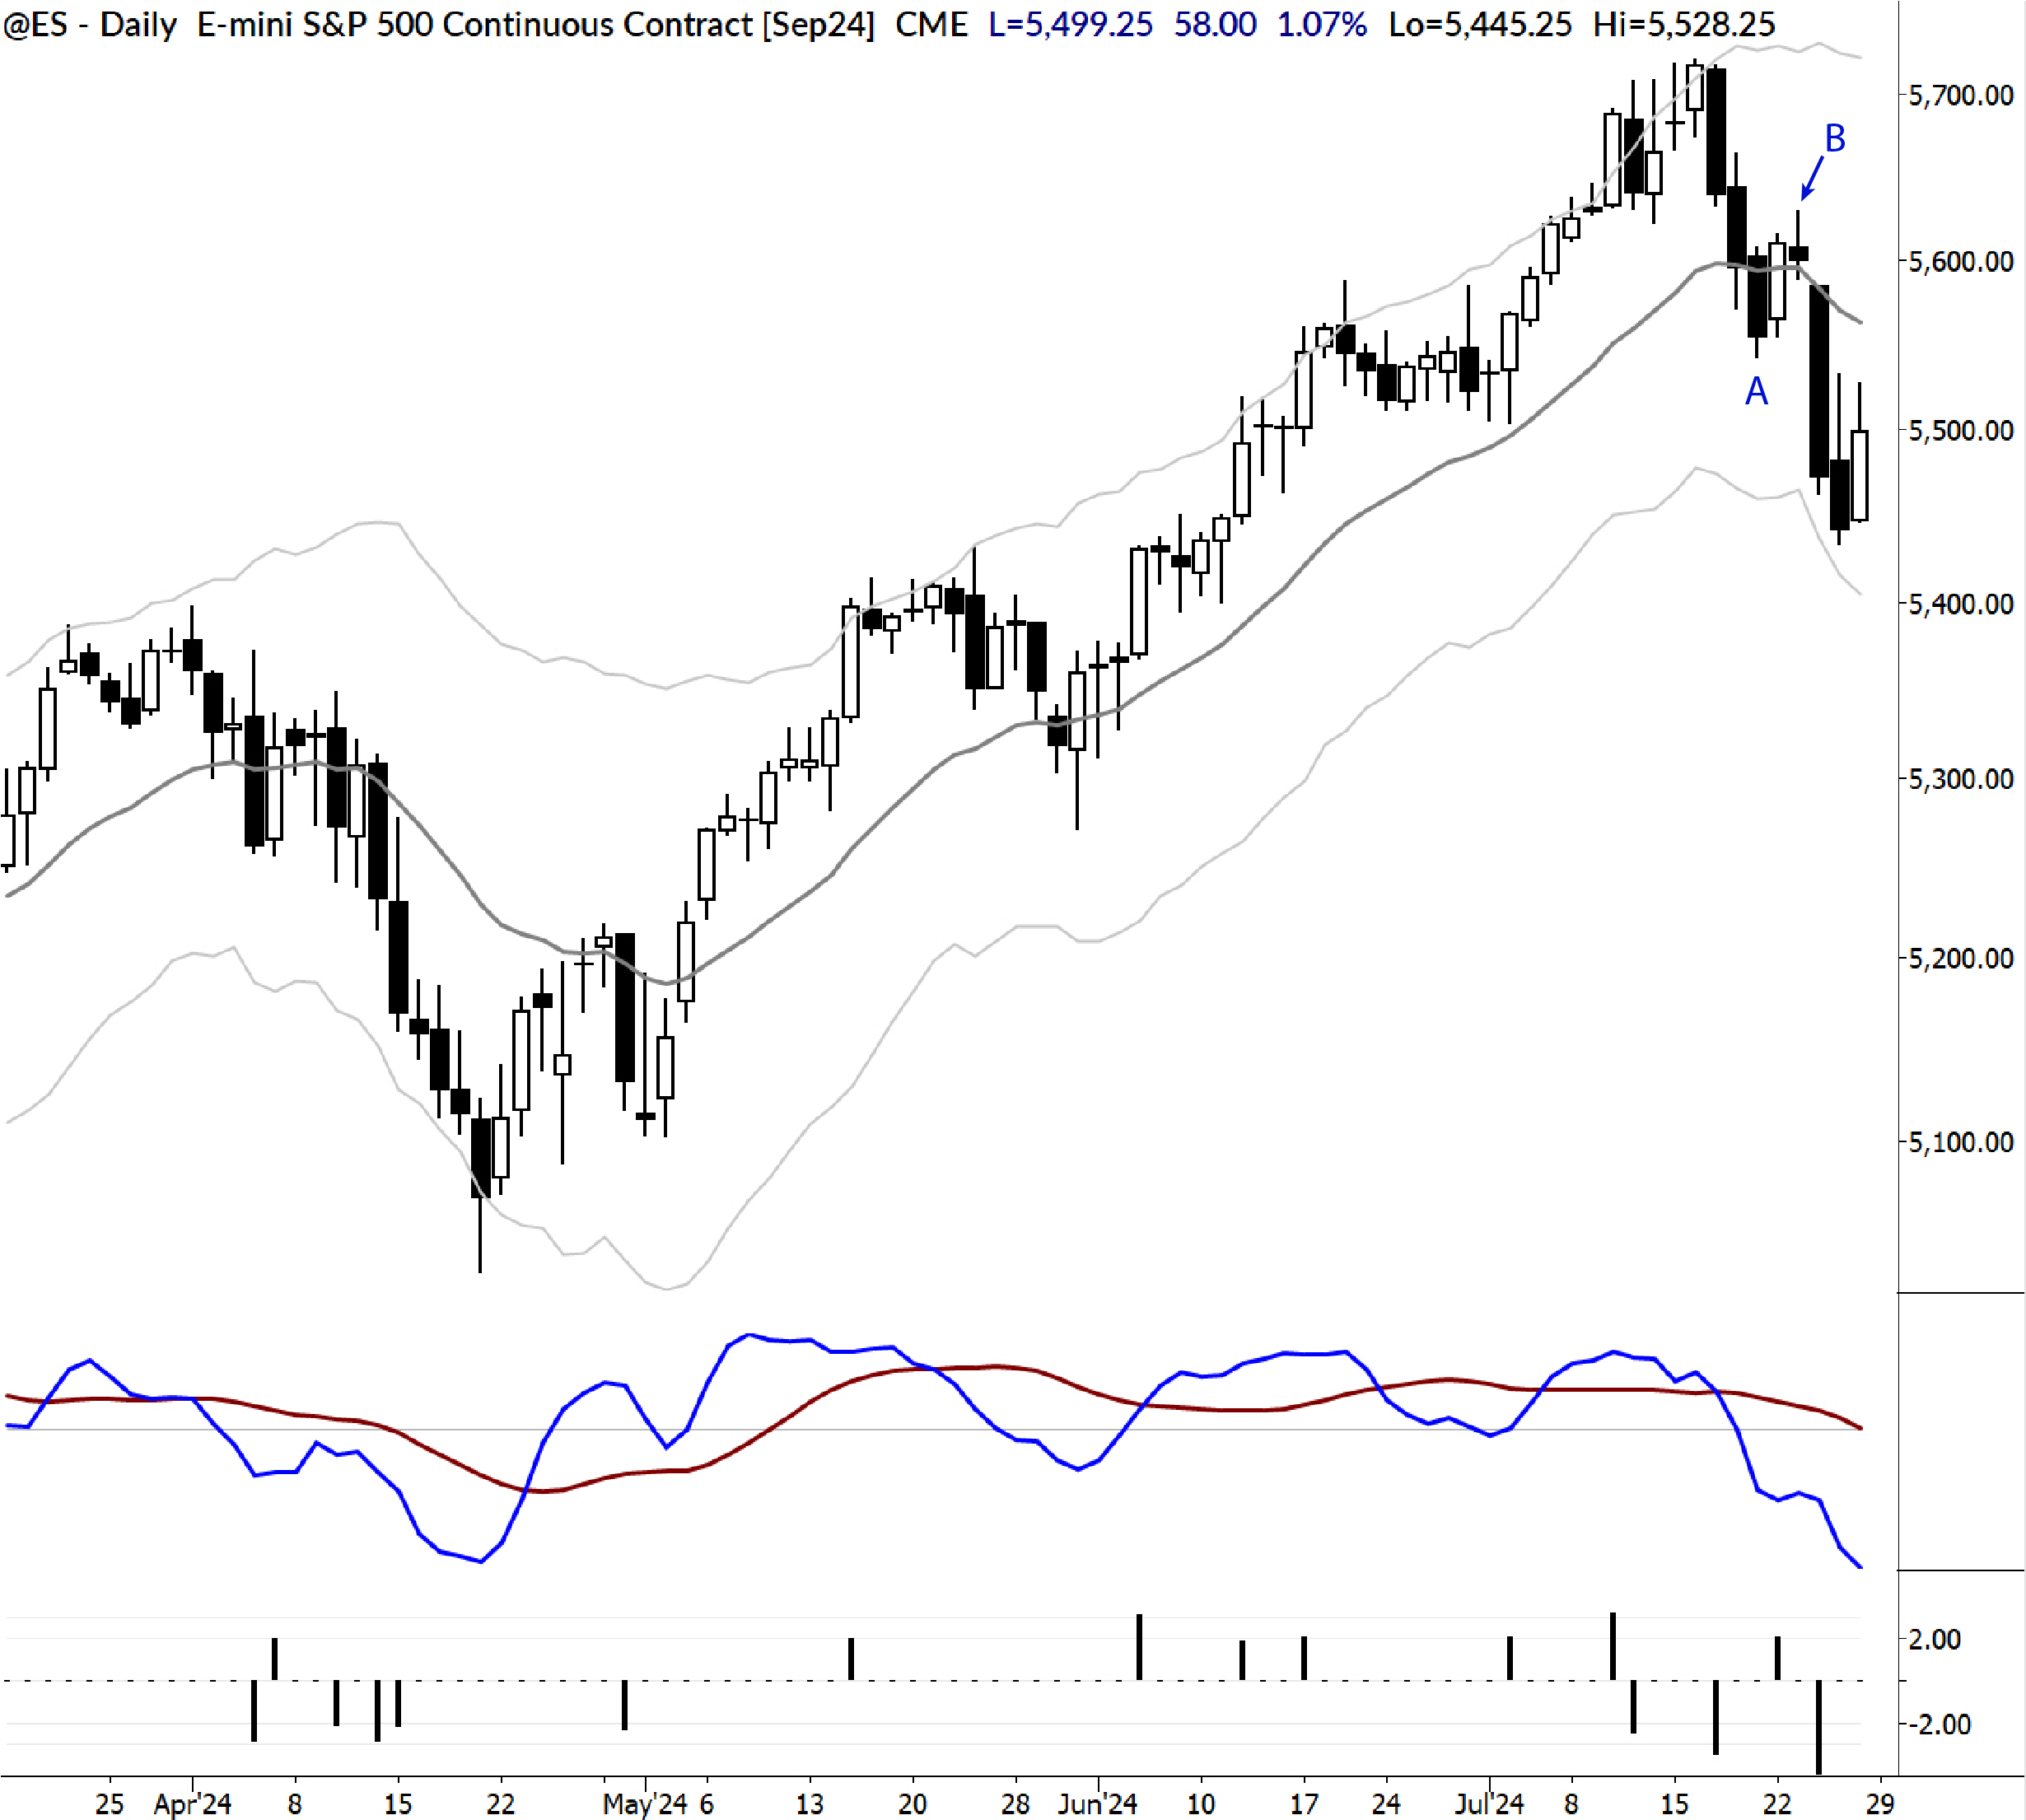
This market has been in an uptrend recently, until some weakness set in. Now, they usually don’t beat drums and sound trumpets to announce a change of market regime. (Actually, sometimes they almost do that…) You have to be paying attention.
In this case, there were clues in the move down to point A. First, there were three strong consecutive selling bars. This is not what we usually see in a strong uptrend. Second, at least one of those bars registered a large downward MAC spike, while recent upward MAC spikes had been muted. Again, this is not what we see in healthy uptrends.
But then, look at the bounce that followed. Though it was only two bars, upside momentum was limited, and we were looking to enter shorts below a breakdown of the bar marked B.
These shorts triggered against our initial stop level (red line on the chart), and we quickly hit our 1R profit target on the day of entry.
How to learn this stuff: ideas for further study
Of course, there’s always some nuance. The Russell 2000 index recently woke up and broke out of a long-term range on impressive upside volatility. One might make an argument that the decline into A was simply mean reversion from that historically strong rally. The bearish setup was not present in all indexes. And many traders might have given the setup a few more bars to mature. (In other cases, I might also have done that. In this case, doing so would have meant missing the trade.)
This was an example that I pulled out in my daily work for our MarketLife members. ChartSchool is a hard-hitting segment of my daily analysis in which I look at one current technical pattern or situation each day, with focus on all the nuances of the pattern. This particular example was great because I had been working through both the bullish and bearish cases for stock indexes, and we set this trade up against my longer-term bias (which remains bullish).
ChartSchool gets rave reviews from our MarketLife members. We’d love for you to take a look at it and the rest of my daily analysis and trade setups. We’ve created a $7 trial that will let you see what my work can do for you. Check it out with a $7 trial.