How to avoid some bad trades

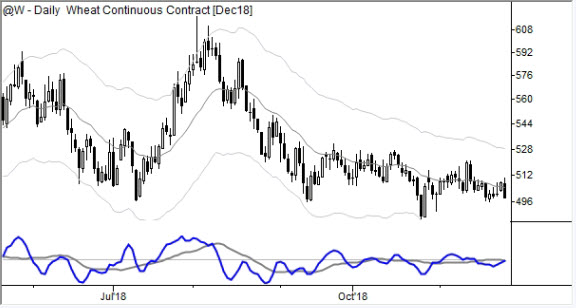
Take a look at the chart above. Notice three things near the right edge of the chart:
- An intermediate term moving average is flat
- Price is never moving far from the moving average
- Price is chopping back and forth on both sides of the moving average
These are three simple conditions that you'll see over and over again, on all markets, and all timeframes. From a practical perspective, what it probably means for directional traders is don't trade.
When you see a market like this, buyers and sellers are more or less in agreement. For directional trades, this isn't good. When no one is really motivated to buy or sell, price movement is likely to be pretty random and we will find that trades have a higher probability of failing.
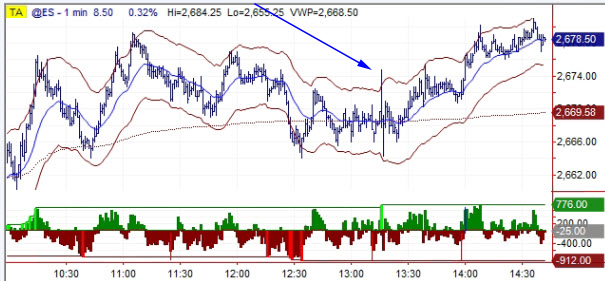
There's also a very good chance that volume is pretty low. If volume is low, liquidity is also likely low. (As I was writing this, I just thought of action we saw a few hours ago. Take a look at the 1 min chart of the S&P 500 futures today:)

See the big spike where the arrow is? What had been happening before that? Nothing--the market had spent many bars chopping back and forth around a flat, intermediate term moving average. Since we knew this was a market to avoid, no one was suckered into paying the breakout or hitting the breakdown spike, both of which failed.
(A few bars later, the market did, in fact, pick a direction. You can also see a more tradable environment emerge after the arrow.)
If you add this one, simple rule to your trading plan, you can avoid many whipsaws. Take a look back at your trade record, and see if a disproportionate number of your losing trades came from an environment with a flat moving average, and a market that could not get away from that moving average.


