First Principles in Technical Analysis (5/?)
Fourth principle: Price Action Around Support / Resistance
continued from this post... and if you are just starting, go here and read the posts in order (from the bottom up.) I think they will make much more sense that way.

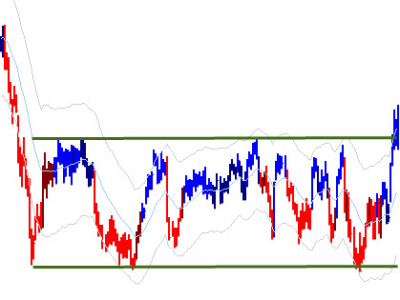
[dc]T[/dc]he last two installments in this series have focused on how prices move in trends; this post will take a look at how prices behave in trading ranges. Compared to trends, trading ranges are periods of more random price activity, usually bounded by fairly clearly defined support and resistance levels. Though I believe support and resistance are two of the most overrated concepts in technical analysis, they do become important in trading ranges. (Too many people see support and resistance levels everywhere. This video provides an interesting perspective on those great support and resistance levels people talk about.)
In the book, I suggest a small, but important refinement to your thinking: do not say "support". Instead say "potential support." This small linguistic change can lead to a significant change in your thinking, because the question we must always be asking is, “will the support/resistance level hold or fail?” (One of the other very important questions is “is this market trending or in a trading range”, but these are really the same question because trends repeatedly break support/resistance and support/resistance holds in trading ranges.) There are some very characteristic price actions associated with levels holding or breaking, and, it is often possible to tell in advance what is likely to happen around a level.
The key element of price action in a support level (I will write this blog dealing specifically with support, but everything applies equally well to resistance) is price rejection at the level. Simply put, as the market comes down to the level, buyers immediately step in and push the market away from the level. It feels (and it is not inappropriate to talk about subjective feelings in these discussions because these price patterns are driven by psychology) like the market does not want to be at the level and there is an immediate and sharp move away from the level. On the other hand, if the market is able to go quiet and dull at support, there is a much higher probability of the level failing. The fact that the market is able to trade at or near (whether slightly above or below) support usually presages the level breaking and price trading through. One pattern (rejection) indicates an imbalance of supply and demand at the level; the other indicates complacency and stops, usually placed beyond the level by a number of market participants, become targets as the level is violated. Remember, one of the functions of all markets is to seek liquidity and trading activity. (They don't teach you that in school, do they?)
A few other points to consider: Words like “soon” and “immediately” must be taken in context of the timeframe, which is why some traders prefer to think in “bars”. If the level is an important multi-year level, price may well do work around the level for many weeks in a successful test. On the other hand, tests of highs and lows of the previous day in individual stocks usually see price rejection within 5-10 minutes if they are going to hold cleanly. Second, anything can happen in the market at any time. Never think that something will happen or something has to happen, because the best we can do as traders or analysts it to define the most probable outcome. Even if we are very good, and are working with a very high probability pattern, we will be right maybe 60% of the time (and often far less), so that still leaves a significant percentage of the time that these patterns do not work as expected. All that matters is you understand the edge and what will happen over a very large sample of trades, and then make sure you are aligning your trades with the probabilities.
Lastly, these patterns are most useful if you own them and make them your own. I have trained traders in the past and one of the exercises I had them do was literally to find several hundred examples of support / resistance both holding and failing on daily charts, and then to examine price action on intraday charts around those levels. You really do have to see many hundreds of patterns before you are comfortable with all the variations of holding and failing (and then failures of failures). I do not believe it is constructive, or even possible, to catalog all of the possible variations, but intuition will slowly grow from repeated exposure. Be aware that there is a tremendous difference between understanding patterns and trading, and this is but one of many important elements of price action.
I will wrap this series up with one more post, connecting these fairly abstract and slightly academic principles with actual trading setups.


