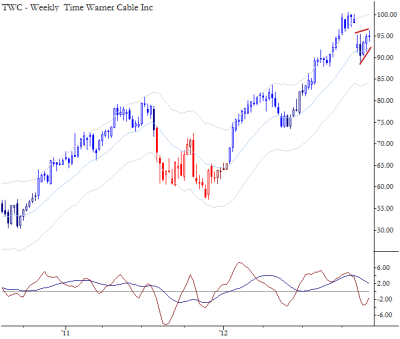
Chart of the Day: Weekly Anti in TWC
A weekly sell Anti setup in TWC contradicts the prevailing sentiment.

[dc]S[/dc]ome of your best trades will come when your patterns (that offer a statistically significant edge) contradict prevailing sentiment. There seems to be a lot of bullish sentiment regarding TWC. I see many bullish tweets, blog posts, and a very well-known stock picking service noted that it was building a base in an article this weekend. (Hint: anytime to want to justify buying a stock that's kind of going sideways or down, just say it's "building a base.") Actually there is a clear pattern in TWC, and it's the opposite of bullish...
TWC shows a weekly sell Anti pattern: a sharp downthrust followed by a weak rally attempt that now reads more as a consolidation setting up another downthrust than a rally. The way to trade this is to be aggressive in pursuing shorts, especially on a breakdown below any previous support—you could do worse than simply entering on a close below the previous week's low. Appropriate stops are somewhere above the high of the consolidation, anywhere from 97.00-101.00, depending on your trading plan and how you manage trades like this. The pattern being decisively violated to the upside would invalidate the setup.
This is not a textbook example of an Anti, but, conceptually, it is valid. I cover variations of patterns like this, along with specific trade management plans, in my book, The Art & Science of Technical Analysis


