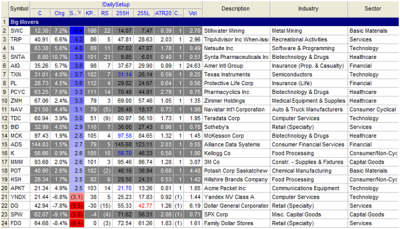
Not exactly a chart of the day, but just a reminder that, if you are a stock trader, you should be conducting a daily scan of your universe to find out what moved. Perhaps your universe is a small set of stocks. That’s perfectly fine. Perhaps you specialize in a sector, or a group of stocks, or maybe you are opportunistic and cover the whole market. All of those can work well, but you still should be aware of what names made large moves on any given day.
If you are a specialist, it might still make sense to check in with a broad market scan. Over time you can see trends (not in the technical analysis sense of the word) develop and you will see where people are focusing time, attention, and money.
I would suggest the best way to filter a list like this is to standardize each day’s move for the volatility of the stock. This list is filtered by my standard deviation measure (discussed in the book, but I’ll also cover it more in future blog posts), but there are many other ways to accomplish the same thing.