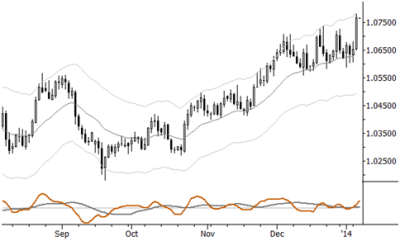
Chart of the Day: Loonie Breakout

No, not a "loony" crazy breakout, a breakout in the Canadian dollar (also called the loonie!) The chart above is of the USD/CAD, so up on this chart is down for the CAD. (Chicago currency futures will be the inverse of this chart.) After a long consolidation near highs, the Channel system we use in our published research triggered an entry into this breakout in yesterday's trading. Though short term currency movements have featured a lot of chop and slop and generally poor followthrough for the past few months, watch the CAD for a potential trend in the first part of 2014.


