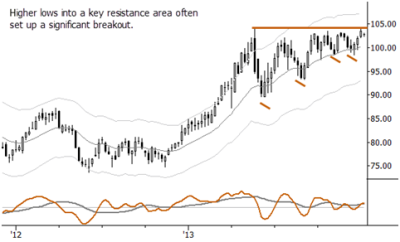
Chart of the Day: Japan

Japan shows a clear pattern of higher lows holding into a ~9 month long resistance area. This is a pattern that often sets up a breakout, but in this case the pattern is on the weekly chart and could presage a significant advance above that resistance. The assumption is that this is a price pattern that can reveal something about the psychology and conviction of the buyers, which, in this case, appear to be strongly bullish. (US traders can trade EWJ to access Japan as an index.)
In a previous post, I discussed issues and problems with biases. Depending on your timeframe, having a bullish bias on the weekly timeframe may or may not be constructive, so consider this in context of your trading plan and risk management guidelines.


