Chart of the Day: Context in ABX

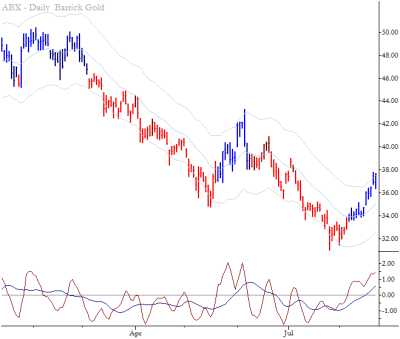
This daily chart of ABX shows a stock that may have found a bottom: after several potential bottoming formations, the rally has carried the stock the upper Keltner channel, suggesting that a pullback could be buyable for a long trade and an attempt at catching a trend reversal. However, there is more to this story. Take a look at the weekly chart.

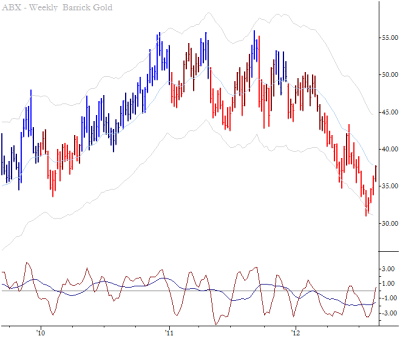
The weekly chart tells a slightly different story: this, so far, is only the second pullback since the breakdown began in earnest near the beginning of this year, and this looks much more like a shortable pullback. What are we to do with this information? Well, it should first of all temper our enthusiasm for any longs, justifying tighter stops and a quicker willingness to get flat if the trade does not play out well. Also, realize that a failure of the long trade would likely be a good trigger for a short entry into this higher timeframe pattern. Awareness of the complexities of patterns like this takes some time to build, but it is not complicated. I cover this, and many other aspects of multiple timeframe analysis, in my new book The Art & Science of Technical Analysis

.// < ![CDATA[ <span style="overflow:hidden;line-height:0px" data-mce-style="overflow:hidden;line-height:0px" id="mce_0_start" data-mce-type="bookmark"> // ]]>


