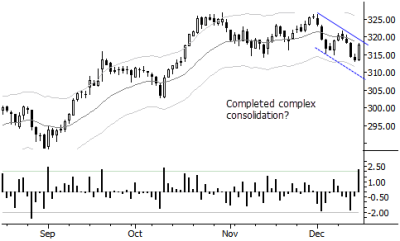
The daily chart of the DJ Europe Stock Index shows a two-legged pullback that could be read as a complex consolidation. This is typically a strongly bullish pattern, and we see similar structures in many other global indexes. Yesterday’s large standard deviation up close is a breakout on lower timeframes and “should” see clean continuation to new highs. There is also value here if this pattern fails—a failure would likely presage a more protracted pullback, leading to several weeks of sideways/downward prices, perhaps testing the parallel trend channel (dotted line) or below. This is one of the fundamental trading patterns I covered in my book, and we will be covering this coming week in my online trading course.
Does the whole market structure also speak for a complex pullback? On the one hand there is a double top which might signal trend termination but on the other hand the mkt structure after the last up swing looks already like a consolidation which has been tested on the low during the last 2 bars and has found buyers which might now test the high of the range.
I like the question as this is in line with questions/doubts I often face. After thinking through it, I believe it does not matter so much whether to call it complex pullback or test of the lower range, but what counts is the strong move indicating an imbalance. And btw, I assume the leader or main driver of the index is the German stock market and looking at the FDAX the pattern may be more pronounced within a still fairly clean trend.
Good points and yes on Germany right now.
I tend to not put too much weight on a double top… overall yes i think the market structure, while not crystal clear, suggests this could simply be a pullback in an intact uptrend. that could be the wrong interpretation (and that could be very obvious next month, next week, or even tomorrow), but that’s where the smart bets are placed right now i think.