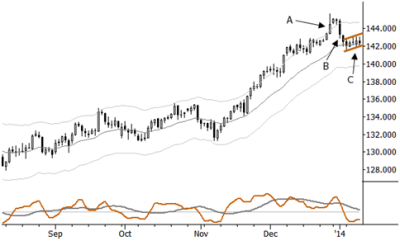
Chart of the Day: Anti in EURJPY

This chart shows a common context for the Anti pattern: following an overextension of an established trend (A), the market makes a sharp counter-trend move (B), and then pulls back in a complacent pullback (C). This sets up a condition that favors the possibility of another trend leg, roughly proportional to the original decline from the high. Note that a similar pattern is also in effect on many daily charts of major stock indexes. Though it is possible to make the argument that the forces of supply and demand are secondary in currencies (which may respond more clearly to a number of macroeconomic influences), these patterns play out in much the same way in different asset classes and timeframes. Watch the EURJPY for pattern resolution this week.
This was the pattern we covered in week 6 of my free trading course; for more information on this pattern, ideas to manage risk, and specific entry and exit techniques, please sign up.


