Basic backtesting in Excel: Doing statistical tests
So this is what we've been waiting for. We finally have the tools to ask simple market questions and to ask some critical questions. If you are new to backtesting, please go back to the beginning and work through the posts carefully. This is a learning process and learning takes time--there's no point in rushing, so give yourself the time you need to learn well and to start internalizing the skills you will need.
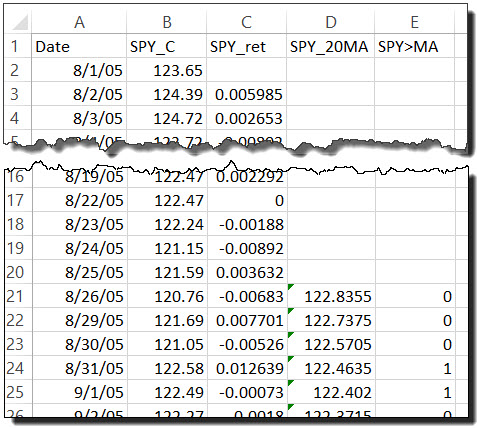
Let's take the spreadsheet we've created in previous posts and clean it up a bit so that it looks like the graphic at right. I have five columns: Date, SPY closing price (Yahoo! Finance), SPY daily returns, a 20 period SMA of price, and an indicator variable that is 1 if price is above the MA and zero if price is below or equal to the MA. If you have the sheet from previous days, you can probably just delete columns to get to this point. (To delete columns: select the column (Ctrl-space bar (shift-space will select rows instead)), alt-E, release, then tap D.)
Two ways to ask questionsWe are going to look at two distinct ways to "ask market questions." The first could be phrased like "when we have seen condition X be true in the past, what market returns have been associated with that condition?" The second question is more like "when condition X occurs, what has the market 'done' in the future?" These are subtly different questions and you need to pick the right tool for the right test. Let's look at how to ask both questions.
Conditional returns
Let's say we want to know what market returns have been when price has been above the moving average. Now, it's important to see a critical difference: we are not asking what has happened after price crosses the moving average (that's the next section of this post.) Think of it like this: let's say we think price being above the moving average is representative of an uptrend. I would furthermore assume that if a market is in an uptrend, returns should be higher than if the market is flat or in a downtrend. (Check your assumptions carefully--I think this assumption is valid, but don't accept it without scrutiny.) Has that been true in the past? Here's how to test it in our simple spreadsheet.
The easiest way we can do this is to use an if statement to refer to our indicator variable, pull the return through if the indicator variable = 1, and return a blank or text value if it is equal to zero. In cell F21 the formula =IF(E21=1,C21,".") gets the job done. (Note:
this formula is correct, but the test, to this point, includes a serious logical error.This is being done for instructional purposes, so just follow along for now.)
Now it's a simple task to copy that formula down to the bottom of the data block; this is important in Excel--any time you make a change to a condition or formula you only change one cell. You are responsible for copying the new formula and making sure the sheet is consistent. (All of these errors I point out I learned the hard way!) Next, we can average the returns above the MA, and find that the average return when prices is above the MA is 0.263% per day. Is that a high return or not? The best way to answer that question is to average all of the returns (column C, but I would delete the first 20 returns since they can never be captured by the MA condition), and find that the unconditional returns average 0.028%. Since that is an order of magnitude lower than the conditional returns, yes, it appears that returns are very strong above the MA. In fact, the unconditional returns annualize to about 7.4% (which passes the TLAR ("That Looks About Right") test with flying colors), while the conditional returns annualize to above 94%.
The TLAR test
Always be thinking and always be asking if results make sense. I use the term TLAR firmly tongue-in-cheek, but the concept is solid: every number or result you see, you need to be asking if it is reasonable or if it is too good to be true. Your first test is always the That Looks About Right test. If it's too good to be true, you've made a mistake somewhere. We've just gotten a potentially very misleading test result in this previous example, but let's forge ahead a bit further.
Event study
The second type of test we can call an event study. When something has happened in the market, what has the market done in the future? In this case, let's ask what happens after price crosses a moving average. This is a good question to ask, and it's important to see the difference between these two tests.
The simplest way to define a moving average cross is to say that today price closed above the moving average and yesterday it closed not above (i.e., below or on) the moving average. Notice the critical use of AND in that statement; the OR we can capture in a few ways, but Excel gives us the standard <= for "below or equal to". In cell G22 the formula =IF(AND(B22>D22,B21<=D21),1,0) will get the job done.
Now, we are interested in what happens after price crosses the moving average? How much after? In this case, let's look at 5 and 10 day returns. There are few ways to do this, but =IF(G22=1,B27/B22-1,".") in cell H22 will give us the 5 day return. (5 trading days is about a week, 20 a month, 60 a quarter, and 252 a year. Five week months and holidays make round numbers only an approximation.) What formula would give us the 10 day returns?
You can obviously extend this to look at returns further out, or can include more periods in the study if you wish. (You could look at every day for a year following each event, but you'd have to use 252 columns to do it this way. This is one reason why better systems than Excel are useful for more in-depth studies.)
What is left?
There's one more post coming in this series, and we have some important things to do:
- What is the error in the test above?
- What other stats should be we looking at?
- How should we think about these stats?
- How can you keep learning more and developing these skills?
- How do we move from market stats to applied trading system?
Some of these I will answer fully in the next post, and some I will point you in the right direction, at least. For now, spend some time working through this sheet and then explore--play with these ideas, tweak the tests, find different ways to look at the data. More than anything, just spend some time manipulating the sheet and doing the work yourself.


