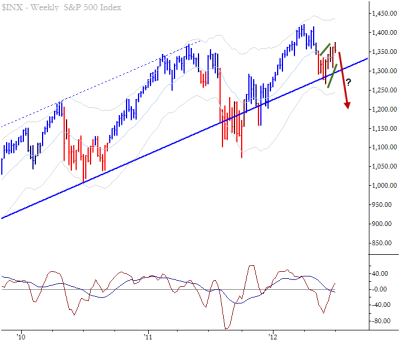
Note the weekly bear flag on the S&P 500 index. You may call it by a number of different names (wedge, pullback, anti, flag, etc.), but the concept is the same: A period of contracting volatility with an upward bias following a sharp selloff. This pattern could be expected to resolve downward, providing a headwind for bearish trades over the next several weeks. Be aware that weekly patterns can take a long time to play out, and there is plenty of room for upswings on daily and intraday timeframes even if this weekly pattern resolves cleanly. Knowledge of higher-timeframe technical patterns often provides good context for trades on lower timeframes. This is an important part of understanding evolving market structure and potential technical risk factors.