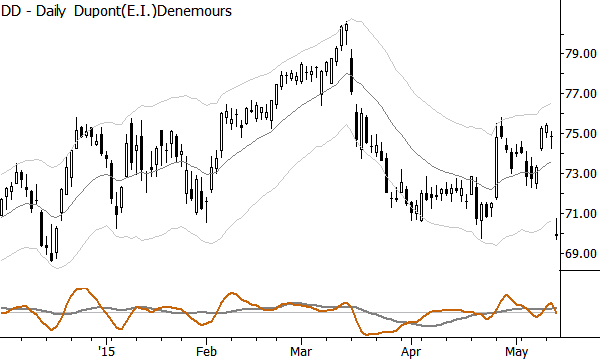
Gaps are important. Gaps on charts can show powerful shifts in market dynamics, and we can identify some interesting tendencies around these gaps. Intraday traders often find an edge in fading gaps, but let’s look today what happens over a longer time span. Consider the daily chart of Du Pont de Nemours & Co (NYSE: DD) below, which shows a large gap to today’s session open:

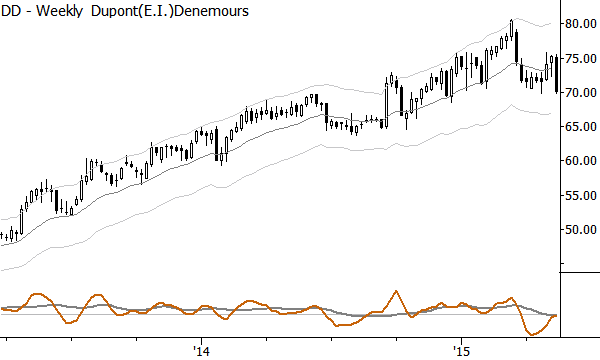
One thing to keep in mind is that stocks tend to mean revert, meaning that big moves on stocks tend to reverse. This is true across a very large sample of data on many timeframes, so, to some extent, we don’t really care what is driving the gap news-wise. (In this case, it is due to DuPont winning a proxy fight.) All other things being equal, we might expect DD to float upwards over the next few sessions and at least partially close the gap. But, all other things are so rarely equal; in this case, there is an interesting and potentially important higher timeframe influence. Take a look at the weekly chart:

On the weekly chart, we have an active sell Anti, which is one of the more powerful and useful patterns I have traded over the years. (I cover this pattern and how to trade it in considerable detail in my free trading course.) This is a simple pattern which basically looks for an established trend (uptrend, for DD), and then waits for a volatile shock against the direction of the trend. On the weekly chart, this was the downswing into the end of the first quarter 2015. Following a period of consolidation, which usually slopes in the direction of the preexisting trend (up), we are on guard for another downswing that will look roughly like the first downswing, in terms of length and volatility.
So, we have a higher timeframe influence in DD that probably targets a move into the mid 60’s. Forget all the exact ratio projections and Fibonacci garbage–it doesn’t matter and it doesn’t really work that well. What you need to know is that there is a higher timeframe influence that is likely to act like a weight on the stock price.
What do you do with this information? Well, one of the practical problems of trading is execution; if you want to short, shorting into today’s gap may be a difficult play, and your stop is probably around or above 76.00. This is not a problem because we likely have a run of that magnitude with a better than 50% probability–we don’t need to be obsessed about finding some theoretical high reward/risk ratio trade, but it does mean that our position size might be smaller than we wish. However, for some traders, shorting into this gap might be a viable strategy. (It would be a mistake, if you were seeing a pattern like this in backtesting, to think that you could have executed somewhere in the gap. Possible, but exceedingly unlikely, even if you respond quickly to news. The spread in that gap could have been several points wide at time–execution is very difficult.)
Some traders might try to “nickle and dime” the market, playing around on the daily or intraday chart in alignment with the weekly trend. That might work for some people, but it also can lead to a lot of small losses that do add up, and general frustration with trades that don’t work out.
Another possibility is simply to be very cautious about buying this gap. If you normally would look for gap closure, but careful here because of the higher timeframe influence. Of course, the gap may close, which simply would have been a losing trade for the short on the weekly timeframe–there certainly are many losing trades out there waiting to happen! Perhaps, though, if you’re looking for gap closure, you would not want to blindly buy this stock; you might require stronger confirmation or you might be quicker to take profits, knowing that you were potentially fighting a strong higher timeframe influence.
This is another case of seeing how higher timeframe technical influences can shape price patterns and price directions on lower timeframes. Let’s watch how this one plays out over the next few weeks.