There is a theory of market behavior that essentially says that markets exist to create trading activity and volume; whether this is precisely true, or whether it completely explains all market activity, is not important. The concept is valid: markets move to levels where orders are clustered. Markets run stops.
As an interesting aside, this happens on large scales (as in the major stock indexes yesterday (10/4/11)), but it also happens on lower timeframes across many markets every day. Back in the days when much of the activity was driven by traders on the floor, there was often blatant manipulation to trigger stop orders. Imagine that you are a floor trader and you think a broker (a trader who handles orders for traders or firms outside the pit) close to you is holding a large position as the market comes down to the low of the day. You can tell that he’s nervous and watching prices closely. You begin to wonder if he has a large position with a stop order under the day’s lows. If so, you could get short and cover into the downdraft created by his sell stops, so what do you do? Well, if you’re big enough, or crazy enough, you can just sell and sell and maybe push the market to new lows, but that’s often suicidal. If the market is thin enough, or close enough to lows, perhaps that’s an option, but there is another way.
Markets have bid / offer spreads, and, in nearly all markets, it is illegal to trade outside of that spread (with some exceptions and provisions). What might you do if the market is 40.02 bid, offered at 40.07, and the day’s low is 40.00? It’s a dirty trick, but perhaps you just call out a trade at 39.98, below the bid, below the day’s low–an illegal trade. Now, one of two things happen… either the broker panics and starts selling to whatever bid he can find. In this case, your “accidental” wrong trade will almost certainly be lost in the ensuing confusion and volume, the market will trade much lower as he sells all he can as fast as he can, so no one really cares about your trade anyway. Or, perhaps he does nothing, there’s no activity at all and you just say something to the effect of “my bad”. The trade never happened, and everyone moves on.
It is much harder to do this in today’s electronic markets, but there are still many instances where stops are run. This is why so many breakouts fail. This is why markets predictably reverse from highs and lows of the day. (This is not the result of nefarious HFT algos as so many bloggers would have you believe. It is simply the way markets work, and they have done this since the beginning of recorded market history.) Markets simply probe beyond levels, trigger stops, and test to see whether there is any further conviction. This happens intraday, and on higher timeframes as well.
One example of this occurred on the 10/4/11 close in most domestic stock indexes. (This is also the pattern I was referring to in my CNBC spot.) Indexes took out significant lows, but there was no conviction beyond those lows and shorts were in a lot of trouble by the close. This is a predictable pattern; I had warned my readers in my Waverly research the day before about this scenario, and suggested they not carry heavy short exposure overnight if the bear trap scenario was in play. (We actually initiated a long position based on the pattern, but that level of aggressiveness may not be appropriate for all traders.)
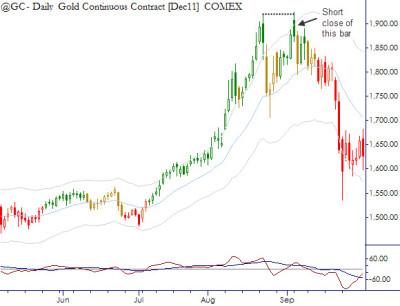
A few more examples will show how important context is. Here is a short trade we initiated (and published) on the exact day of the high in Gold futures. We had been warning clients for weeks that the uptrend was parabolic (note free bars), and suggested that a retest of the highs was an ideal spot for a bull trap. At the very least, never get caught paying a “breakout” here.
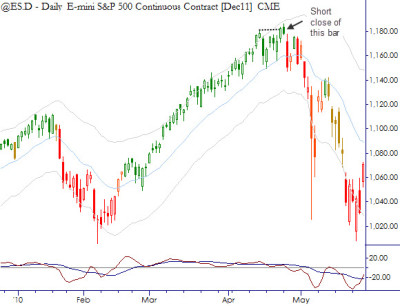
And one more from a year ago, note here the extended uptrend went parabolic (though only slightly in this case), and then a clean failure test at the highs provided an ideal entry for a short trade. When we published this trade last year, we had no idea that the Flash Crash would follow a few weeks later.
We will look at this pattern in more detail in the future. It is a simple, robust pattern that plays out in all timeframes, and it is also the first of the actual trading patterns I cover in the book. There is, of course, considerable nuance and subtlety to these patterns. (For instance, notice that the second and third examples were set up by overextended trends, while the first set up following only a single, strong downthrust. The first example is not as strong of a trade.) If you are a technical trader, some variation of this pattern belongs in your toolkit, but, as always, make sure you do the work to truly understand the pattern before you commit capital and risk in the market.


Awesome post, really insightful. All the best to you and your book.
Thank you. Glad it was helpful… I’m going to expand on this post and this pattern over the next few weeks as well.
Pingback: Market Pattern: The Failure Test | Adam Grimes | Latest Gold and Silver Trading News | Scoop.it
Pingback: Current Technical Situation: S&P 500 | Adam Grimes