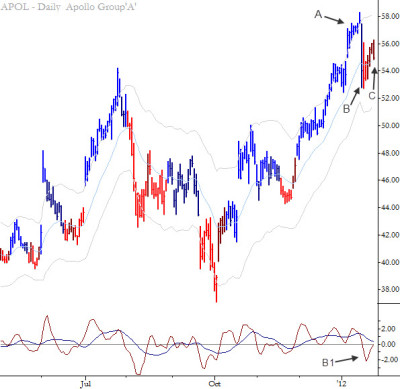
1/26/12 Chart of the Day
[dc]T[/dc]his chart shows an Anti pattern in the chart of Apollo Group, Inc (Nasdaq: APOL). This is an important trend termination that often leads to some very clean trades. This is a repeatable pattern in all timeframes:
- A: Overextension. (In this case 3 pushes and climax beyond the upper Keltner channel.)
- B: Sharp countertrend momentum indicating that sentiment and control has shifted in the market.
- B1: Note that this also takes the MACD to a significant new low, relative to its recent history.
- C: Small consolidation. In essence, this is the first bear flag in a possible new trend. The actual entry is on a break out of that consolidation.
This chart was taken midday at the time I entered a short trade with an initial target in the mid 52's. The term "Anti" was coined by my friend and mentor Linda Raschke in Street Smarts: High Probability Short-Term Trading Strategies

, and it is also one of the seven trading patterns I cover in considerable detail in my book.


