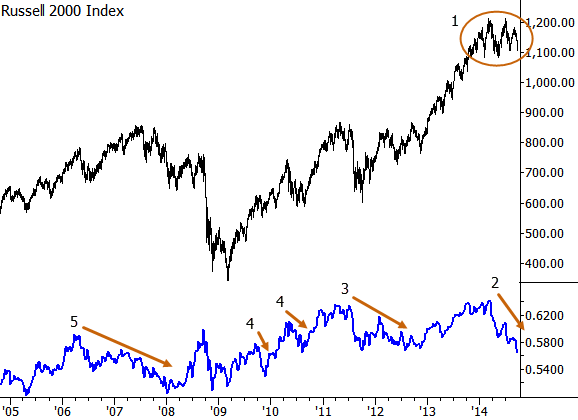
A lot of people are focusing on the recent small cap underperformance today. Let’s take a look at a little bit of history; here is a chart of the Russell 2000 index (representing small and mid cap stocks), with a line underneath showing its relative performance relative to its larger cap cousin, the S&P 500 index over the past few years:

A few points to think about:
- The market has been in consolidation all of 2014, despite some momentary new highs. In consolidation, rotation is normal and to be expected.
- The recent underperformance is not especially dramatic, in historical context.
- It has happened before…
- In fact, nearly every market setback or consolidation has seen small caps lag. The market is currently in consolidation (1), so… no big deal? Maybe.
- Small cap underperformance was a feature of the 2007-2009 crisis, but that does not mean that every jiggle in small caps will lead to another crash.
For market forecasters, it’s easy to point to technical factors that might be significant, make dire predictions, and then just roll the dice and see what happens. If the market crashes, go on CNBC and Fox and be the genius; if the market just continues higher, people will forget you ever said anything–one reason pundits have such loud voices is because of this asymmetrical payoff.
For traders and people actually managing risk in the markets, it’s a very different story. If you actually critical to find factors that are likely to be significant, and the recent small cap underperformance does not appear to be one of these factors. Focus on what matters.
Pingback: About Those Small And Mid Caps... |
Pingback: About Those Small And Mid Caps… |