This post will be a bit more technical than most, but it’s an important subject to understand. Today, let’s talk about rolling and back-adjusting futures prices: why we did it. How we do it, and what it means when we look at historical charts.
Futures pricing
First, a little quick background. When you look at historical charts, the prices you see may not be the price at which the asset traded. (More on that at the end of this post) Currency prices are relatively straightforward. Stocks have some possible issues with splits, dividends, corporate actions, and special distributions, but futures prices are particularly complicated.
Futures products trade for delivery at a specific point in time, called the delivery month. Some products trade every for month, and some others only trade a few months out of the year. The table below shows a year of crude oil prices, along with average volume and open interest for each month.
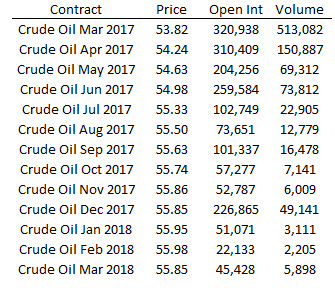
The first thing that jumps out from this table is that each month trades at a different price. When we talk about “the price of crude oil”, it’s not one thing. Sometimes people are referring to spot price (cash, or what you would pay for it today), but generally people mean the front month, or the month that is at the top of the strip.
In most physical commodities, further out months trade at higher prices than near months. Many things influence this relationship, but one of the major factors is the cost of storing the commodity. (You would have to put it in a warehouse or storage tank, pay for the space, pay insurance for it, etc.) Supply and demand and seasonal factors can also change these relationships, and every product has a different set of influences, but the most important thing is that it would be unusual for months to trade at the same price—expect that each month on the strip will trade a different price.
Why and when do we roll?
Because futures trade for different months, at some point in time each contract goes away (i.e., expires or goes into delivery.) If we trade futures, we are forced to roll our position to the next month. In crude oil, we might sell Mar our existing long position today at 53.82 and buy Apr at 54.24. What is the P&L impact of this transaction? (For this article, assume that we eliminate all transaction costs and frictions.) It is not the $0.42 difference between those prices, because we simply sold something at the first price and bought something different at the second; the P&L impact of the roll is zero.
It’s helpful to think of these rolls from the perspective of the trader holding a position through the roll. If you haven’t thought about this before or are new to futures, you’re likely to get a little bit twisted around as you think through the potential issues, but just go back to the perspective of the long-term trader who holds one month before the roll and another after the roll. For that trader, the roll does not generate any P&L (but it may create a difference in invested capital or position size.)
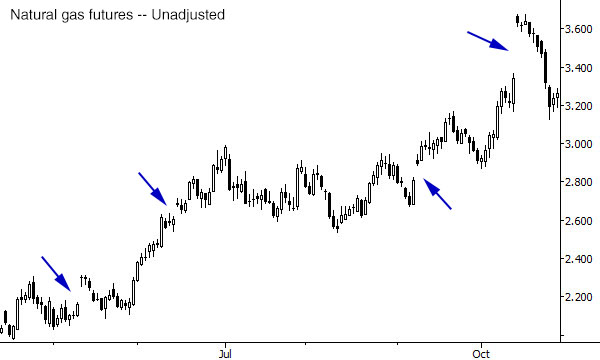
The problem is that if we stitch historically contacts together, we will see a price jump (or a gap on the chart) that did not actually occur. Look at the natural gas chart below—none of the marked gaps on this chart are “real”. This chart was created with no roll adjustment, and these big jumps are simply the difference between the two months when open interest rolled.
As for when we roll, most commodities have a delivery schedule, and most traders who do not intend to take delivery get out of the way. We can see that open interest generally moves to a new contract within a few days, and this is one of the factors we can use to decide when to roll. When we look at historical data, we can roll when the open interest moves to the next month. (Note that this isn’t as simple as we might expect. Open interest can have some distortions, and some products are more active in some months. (Look at Sep and Dec in the table above.) We can also roll on a fixed schedule, but this is less effective as product structures have likely changed over the course of decades. Other possibilities include rolling when open interest and volume shift, or doing something like moving on the third day that open interest is higher in the next month.
If you are doing this historically, it’s important that your roll methodology matches, as much as possible, how you will trade. Objective and consistent criteria are the best, but don’t get too caught up in the choice of when to roll. How you roll is much more important.
How to roll: Unadjusted
There are three basic ways to roll futures contacts. Look at the table below, which shows a theoretical (and very well-behaved!) futures product that reliably goes up exactly one dollar every day. The first column is simply a counter for the roll day (the day on which we will do the roll). The next two are prices for Jan and Feb contacts; note that Feb always trades at a $5 premium to Jan. For this simplified example, assume that the Feb contract does not exist and does no trade before the roll date.
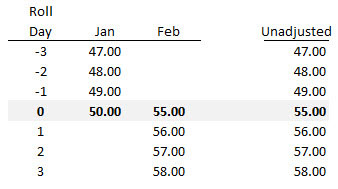
The last column shows the first of our three adjustment techniques: we do not adjust prices at all. Rather, on the roll day, we simply start recording prices for the new contract. Note that this method will show a large price jump: $6 on the roll day. This price jump accurately reflects the difference between the two contacts and the daily price change, but it will distort any backtest we do. There was no way to capture this theoretical $6 through any trading activities.
A non-adjusted chart shows historical price levels correctly, but it distorts price changes. From a practical standpoint, we will often see a lot of gaps on the chart that never happened. We’ll come back to that in a moment, but let’s look at the next way to adjust prices.
How to roll: difference-adjusted
To get rid of this phantom price change on the roll date, we have to adjust prices. Broadly, there are two choices: we can start with an actual price in the past and adjust forward, or start with a current price and adjust back. Because it’s helpful to have the current price match the current price of our series, we always back adjust. This is an important point: when we adjust futures contracts, prices you see on your historical charts are not the prices at which the instrument actually traded.
The first way to do this is to take the price difference between the new and old contacts, and to add that difference to old prices. Here’s how you do this:
- Choose your roll dates according to your chosen roll methodology
- Start at the current price, and work backward. On each roll date, calculate the roll differential: new contract price – old contract price.
- Calculate a cumulative roll differential, which is simply tomorrow’s roll differential + tomorrow’s cumulative roll differential. (Remember, we are working backwards in time.) This cumulative roll differential will only change on the day before roll days, and will simply be tomorrow’s value for all other days.
- Add this cumulative differential to the front month (the month you were actually trading) at the time.
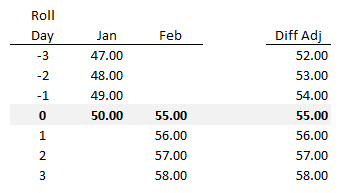
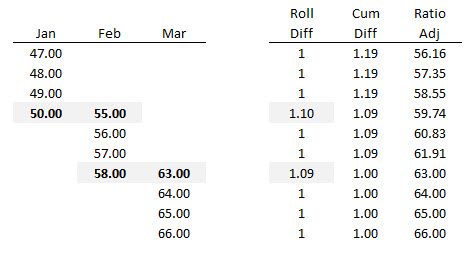
This might seem a little bit complicated at first, but look at the table above and consider the roll (highlighted in grey) from a $50 Jan contact to a $55 Feb contract. On the roll day, we go home holding $55 Feb. The day before, we went home holding $50 Jan. On the roll day, prices actually increased $1, so, obviously, we do not want our price series to show 55-49 on the roll day. The way we remove this price difference is to raise the previous day’s price by the $5 difference of the roll. Now we have a theoretical (back-adjusted) price of $54on the day before the roll, accurately reflective the $1 price increase that actually did occur. In reality, both months usually do trade before and after the roll (though not all months will see the same price changes every day.) I’ve just made a very simple example here to illustrate the technique.
How to roll: ratio-adjusted
The difference-adjusted technique preserves the price changes, in points or dollars or whatever, for all historical prices. There is another technique we must use if we wish to preserve the percent changes (returns). Here’s how you do this:
- Choose your roll dates according to your chosen roll methodology.
- Start at the current price and work backwards. Create a variable called roll differential, and set it to 1 for all days. For roll days, the roll differential is new contract price / old contract price.
- Create a new variable called cumulative roll differential, and set it to 1. Work backwards, and calculate cumulative roll differential = tomorrow’s cumulative roll differential * today’s roll differential.
- Multiply the front month price by the roll differential.
The table below shows this technique applied to our theoretical series.
Here’s the important stuff
An unadjusted chart shows levels correctly, but distorts the way price moves from day to day. It’s good to see what price levels the market actually traded at, but probably not good for much else. Difference-adjusted charts are the de facto standard from many vendors. They preserve the point values of each swing, but prices can go negative and percent changes are seriously distorted. Ratio-adjusted charts keep the percent changes, but the point values are going to be out of whack. (You can’t have both percent changes and differences correct. You must choose one.) With these differences in mind, let’s consider some issues for system developers and chartists.
Backtesting
If you’re doing backtesting, you must use the methodology that relates to your chosen P&L reporting method. In the early days of system testing, the early software focused on points or ticks won or loss, and this is preserved in many software packages today. If you count P&L in ticks, then you must use a difference-adjusted contract, since this adjustment method keeps the point or tick changes on each day correct.
However, if you calculate your P&L as percentages or returns, you must use a ratio-adjusted contract. To take this to the extreme, it’s not all that uncommon to see a long difference-adjusted contract have historical prices that are negative. Imagine what happens when you try to calculate a percent change from a very small number—you’ll get a change that is in the thousands of percents. Or what happens when you calculate a percent change from a negative number? Or from zero—aye, you risk a divide by zero error and punching a hole in the very fabric of space-time itself. (Well, perhaps not, but it’s still bad!)
Just to be clear, you must use some back-adjustment methodology if you are doing historical futures testing. You can also, of course, model the actual rolls, but you still need to figure out how you calculate your entry signals; with some markets, you won’t have much data in new contracts so you’ll need to link somehow.
Charting
There’s a more pernicious problem, and many chartists seem completely unaware. Take a look at the chart below, which shows a standard difference-adjusted crude oil chart compared to an unadjusted chart. Notice that both charts end at the same point, but diverge quickly going back through time.
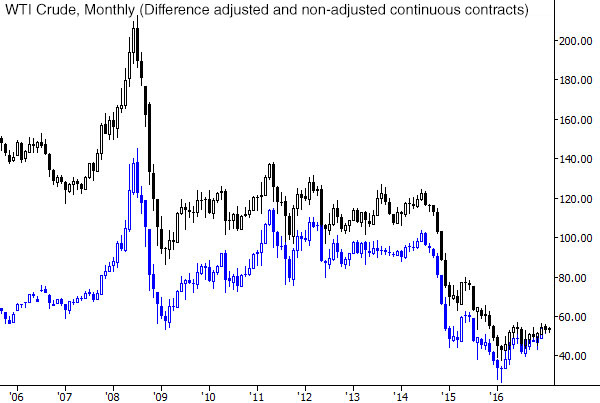
Back-adjustment, of course, moves historical prices around. This means that the prices you see on your chart were not the prices at which the instrument actually traded. So the argument that price has a memory and this is why support and resistance works… does this argument hold water if the levels do not correspond to past prices? I would argue probably not.
Another, similar, problem arises when you try to apply ratios to past swings. If we are using adjusted charts then the magnitude of past swings can be distorted, sometimes in very serious ways. When I began to understand the issues with historical charts (and, stock traders, your charts suffer from similar issues—that long term support or resistance may or may not be a real price) this was one of the major steps in moving me toward a more analytical approach to markets and trading.
At the very least, you need to understand the roll methodology your data vendor is applying. More and more vendors are making this transparent, and even letting you define criteria for the roll. The choice of roll date, months to include, and back-adjustment methodology can result in hundreds of possible charts for any given market. Understand your data and the choices behind that data.
For chartists, many of these issues could be resolved by using spot prices or an unadjusted price chart for part of your work. For instance, consider using spot prices for levels and an adjusted chart for backtesting and pattern recognition work. There’s a lot more behind those historical price patterns than we might think at first glance—dig deeply and work to understand the choices behind them!
Pingback: Quantocracy's Daily Wrap for 02/10/2017 | Quantocracy
If only looking at the front month/quarter contract are we fine using the unadjusted?
Pingback: 12th February 2017 – Nikhil Dogra
Pingback: 02/14/17 – Tuesday’s Interest-ing Reads | Compound Interest-ing!
Pingback: Artikel über Wirtschaft und Devisen 19. Feb 17 | Pipsologie
wow amazing post. Thank you! Never understood the rolling and connecting of futures contracts. And also, never appreciated before, how messed up my charts are…
Pingback: Which Closing Price? - Rayner Gobran LLC