Putting momentum to work for you
Financial markets are confusing--there's no doubt about that. Sudden reversals, spikes, dull dead periods exploding into panic, fakeouts and fakeouts of fakeouts... the list goes on, but traders and investors quickly discover that reading the market is far from easy. Wouldn't it be great if there were some way to simplify all of this and to highlight what really matters? There are some useful tools, and measuring momentum can help us to focus on the most important aspects and price structures in a market.
Momentum
It's a good idea to spend a little bit of time nailing down some precise definitions, because the language of Traditional Technical Analysis (TA) is often imprecise. Momentum is one of the academically accepted market anomalies; academic papers are written on the subject, portfolios are constructed on a foundation of momentum factors, and the "momentum effect" is a serious challenge to people who believe that all market movements are random. However, and this is important, be aware that "momentum" in this context has little to do with momentum as technicians use it. The academic anomaly is closer to relative strength: the idea that strong assets (measured over some look back period) tend to get strong while weaker assets get weaker.
When technicians speak about momentum they are usually talking about an "oscillator" that is plotted below the price bars. Momentum and Rate of Change are two indicators you'll find in most software packages; momentum usually takes today's price and subtracts a price at some fixed point in the past. Rate of Change divides today's price by a price in the past, giving a percent return from that point. Many (most?) traditional applications of this tool are purely visual; both calculations produce the same shaped line when plotted (though the values are different), so they are interchangeable in most cases. Just be aware that the momentum of technical analysis is not the momentum most finance papers (or quantitative managers) think about, and that the TA momentum is basically the first derivative of prices: the rate of change of asset prices.
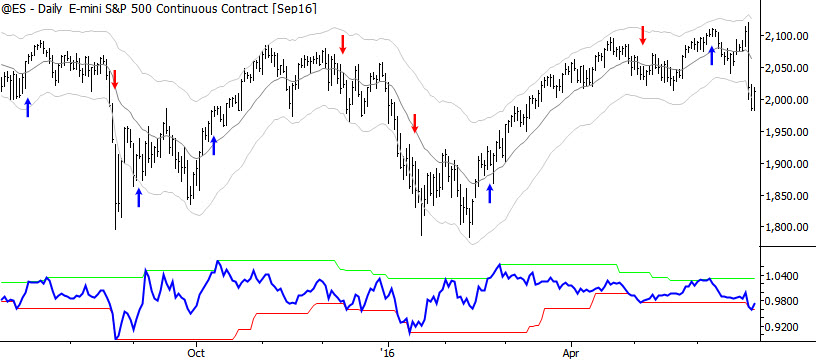
In the chart below the line plotted below the price bars is simply the current price divided by the price 10 days ago. For simplicity, we'll call this the one month return, but you can substitute any similar calculation.

Trading signals from momentum
Let me show you one way to use momentum to generate good trading signals. The idea is that we want to look to trade pullbacks or consolidations following momentum extremes in markets. In other words, when a market makes a strong, new momentum move in one direction, we wait for the reaction and then trade in the direction of that momentum. Another way to say the same thing is that we are looking for (for a buy signal) a momentum high, and then will look for a long entry signal following that high. (I may not have dropped the arrows on exactly the right bars. This is not a system that I trade in this format, but the concept is important. Even if the points marked are not precisely correct, the concept is clear.)
On the chart above, I've also coded red and green "channels" on the momentum indicator itself that show 40 day highs and lows on the momentum line. Apply a simple trading rule: when the momentum line makes a new high (meaning the green line goes higher), look to take long trades on the first pullback. The reverse applies for shorts. I've marked the spots on the chart above where momentum makes a new high or low with arrows on the price bars. Note that these are not entry points--they're points from which you would start to look for an entry in the indicated direction. This is a very simple "system" (it's not a complete system at all, hence the quotes), but, more often than not, it puts us on the right side of the market.
[box] If you want to explore this idea on your own, here's a snippet of TradeStation EasyLanguage code to generate the lines in the indicator:
vars: len1(10), len2(40); mom = c / c[len1]; hh = highest(fastl, len2); ll = lowest(fastl, len2);[/box]
Refining signals
This is a very rough tool, and is more to explain the concept than to give exact entry points. There are a number of things we can do to make this system better; one of the best is not to trade after a potential climax move, but we need to define that concept with precision. Ideas might be looking for large extensions outside the Keltner Channels or canceling potential entries if a conflicting signal quickly emerges. An example of this is the first red arrow, marking a potential short trigger, on the chart above. First, the bars that generated that signal were extended far below the lower channel. This might be a warning, but then we had a potential long trigger develop 9 bars later. If we're looking for shorts a a new momentum high develops (on the trading timeframe), that might be a warning sign that something is wrong.
This is also far from a complete system. We still need all the important things like stops, profit targets (or not), position sizing, and to define precise entry triggers. However this is a simple quantitative measure that can get us aligned, more often than not, with the right side of the market. This idea can be incorporated into quantitative systems, but it's also a good tool for discretionary traders, and perhaps a good way for developing traders to build some structure around their developing market analysis.
I'll leave you with a last thought and an observation: that's an interesting new momentum low on the S&P 500 at the right side of the chart, isn't it? ;)


