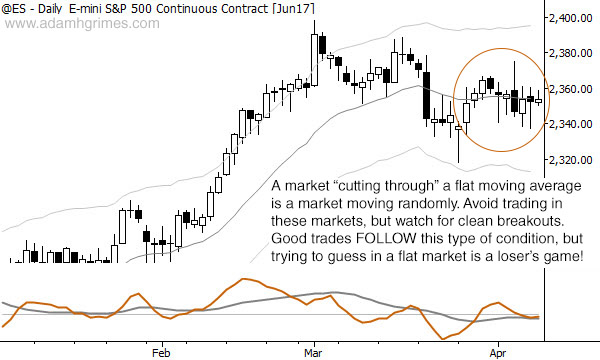
Chart of the day: Why it’s been hard to trade stocks
- Post author:AdamHGrimes
- Post published:04/10/2017
- Post category:Chart of the Day
AdamHGrimes
Adam Grimes has over two decades of experience in the industry as a trader, analyst and system developer. The author of a best-selling trading book, he has traded for his own account, for a top prop firm, and spent several years at the New York Mercantile Exchange. He focuses on the intersection of quantitative analysis and discretionary trading, and has a talent for teaching and helping traders find their own way in the market.
You Might Also Like
This Post Has 8 Comments
Comments are closed.
Is that Keltner channel or Bollinger band? can I use Bollinger since I don’t have Keltner at my platform? I’ve been using only 20 EMA so far but I’d like to set keltner or Bollinger to get also perspective to view free bars and potential climax or just oversold/overbought conditions.
Keltner channel exists in all trading platforms, look in indicator. If you want same width you must insert in parameter “Multiplier” =2.25.
Well, I’m using Oanda’s platform fxTrade and it does have only BB unfortunately
Sorry, i`am never used FX platform only stock and futures. But for week/day data analyze you can use same different platform (ex. tradingview or ninja trader). And after trade your idea on your broker platform.
Tom, I believe Keltner channel is the same as Starc bands, if your platform has that.
I just tested this, and yes, Keltner and Starc are exactly the same.
Perfect, I’ve got Starc, what kind of setting are you guys using? I need to set SMA, number of ATR periods and multiplier. Thank you
I generally go with 20 MA, 20 ATR periods, and 2.25x multiplier.