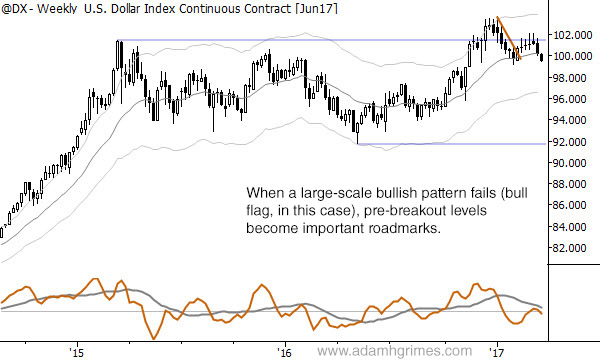
Chart of the Day: Failed bull flag in the Dollar
- Post author:AdamHGrimes
- Post published:03/24/2017
- Post category:Chart of the Day
AdamHGrimes
Adam Grimes has over two decades of experience in the industry as a trader, analyst and system developer. The author of a best-selling trading book, he has traded for his own account, for a top prop firm, and spent several years at the New York Mercantile Exchange. He focuses on the intersection of quantitative analysis and discretionary trading, and has a talent for teaching and helping traders find their own way in the market.
You Might Also Like
This Post Has 3 Comments
Comments are closed.
So True, one of the most important Charts around !
Why this is not possible to treated as a complex pullback but as a fail pullback?
I’ll take a stab at this. Some failed simple pullbacks do evolve into complex pullbacks. However, in this case the market has been pulling back for 2 weeks already which is about as long as the initial upthrust. Also, a complex pullback would target the lower keltner bands, perhaps a bit too far on this timeframe?
I’d love feedback on this too as I’m currently doing the pullback research of the trading course.