Pullbacks are a great way to trade. But, with any trade, the problem is that some trades work and some don’t. There are ways to tell which pullbacks are more likely to lead to winning trades, and one of the best ways is to put the setup in context. This can sound mysterious, but it’s really not.
The goal of any pullback trader is to catch the second move. In other words, you wait for the market to make a move, and then you look for continuation in the direction of that move. One of the key things we assess is the character of the pullback—its magnitude, velocity, and overall character—but the setup leg is just as important. The question you’re asking is, “Should this move see continuation? Is it likely to lead to a move in the same direction?”
Context matters
What we’re really talking about here is context. Here are a few of the things I consider when looking for the best pullback trades:
- Good momentum in the leg. We can often see this by the leg touching a (properly calibrated) channel or band.
- But not too much momentum, which can be indicative of climax.
- It’s great if the setup leg is a surprise, meaning that the move caught many traders off guard. Traders often will sit through one move against their position, but will bail on the second move; this can be great impetus for your trade.
- Be careful of legs which are themselves measured move extensions of another leg.
- Be careful of legs which could be pullbacks on a higher timeframe.
Real examples
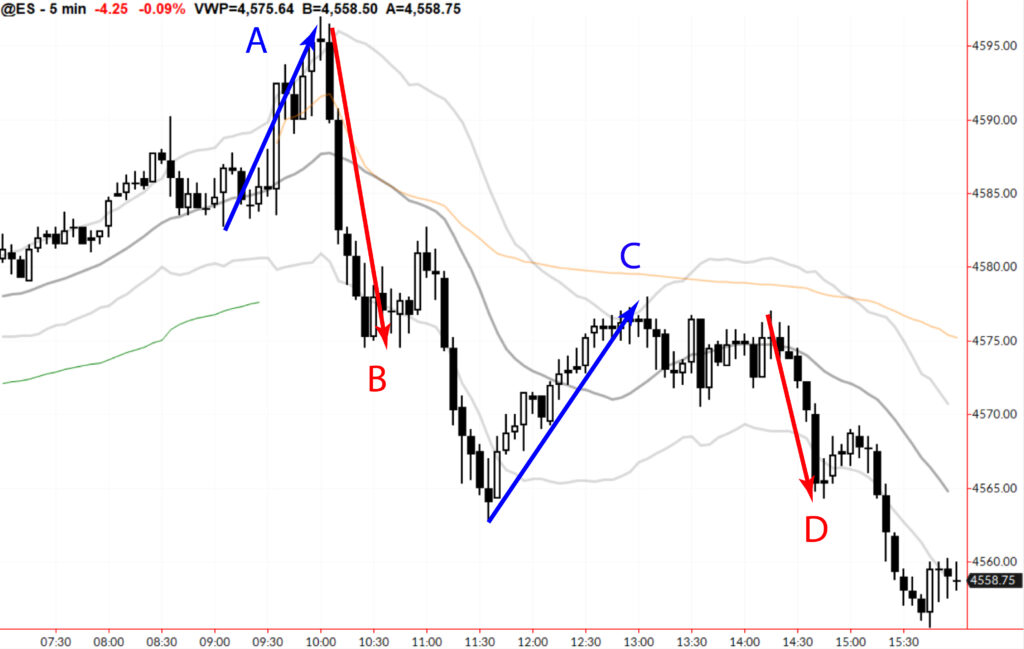
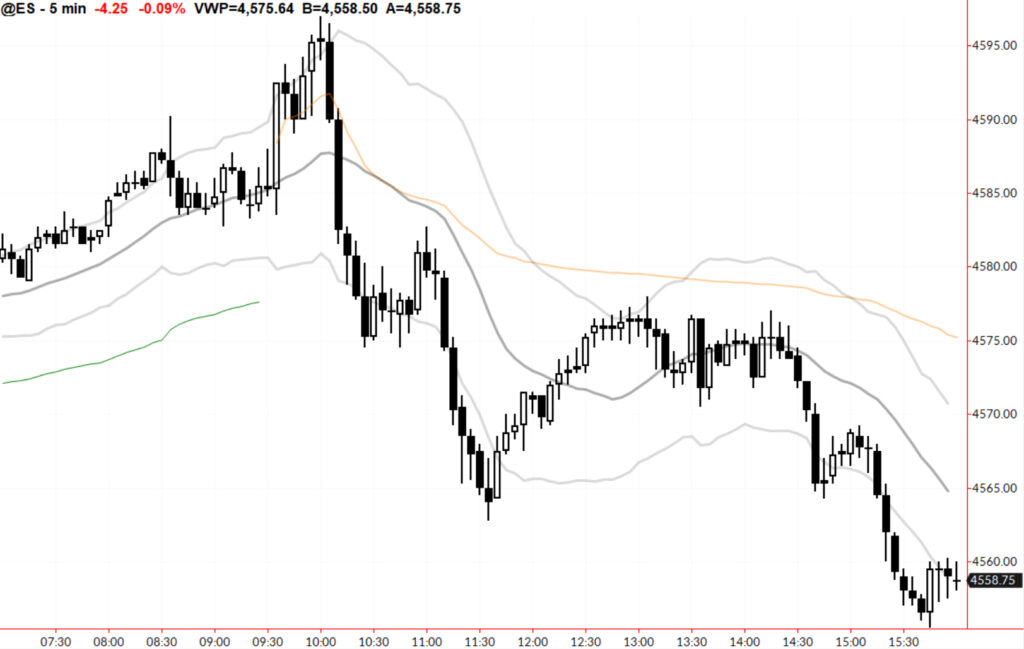
Here are some concrete examples, drawn from the S&P futures on 11/29/23:


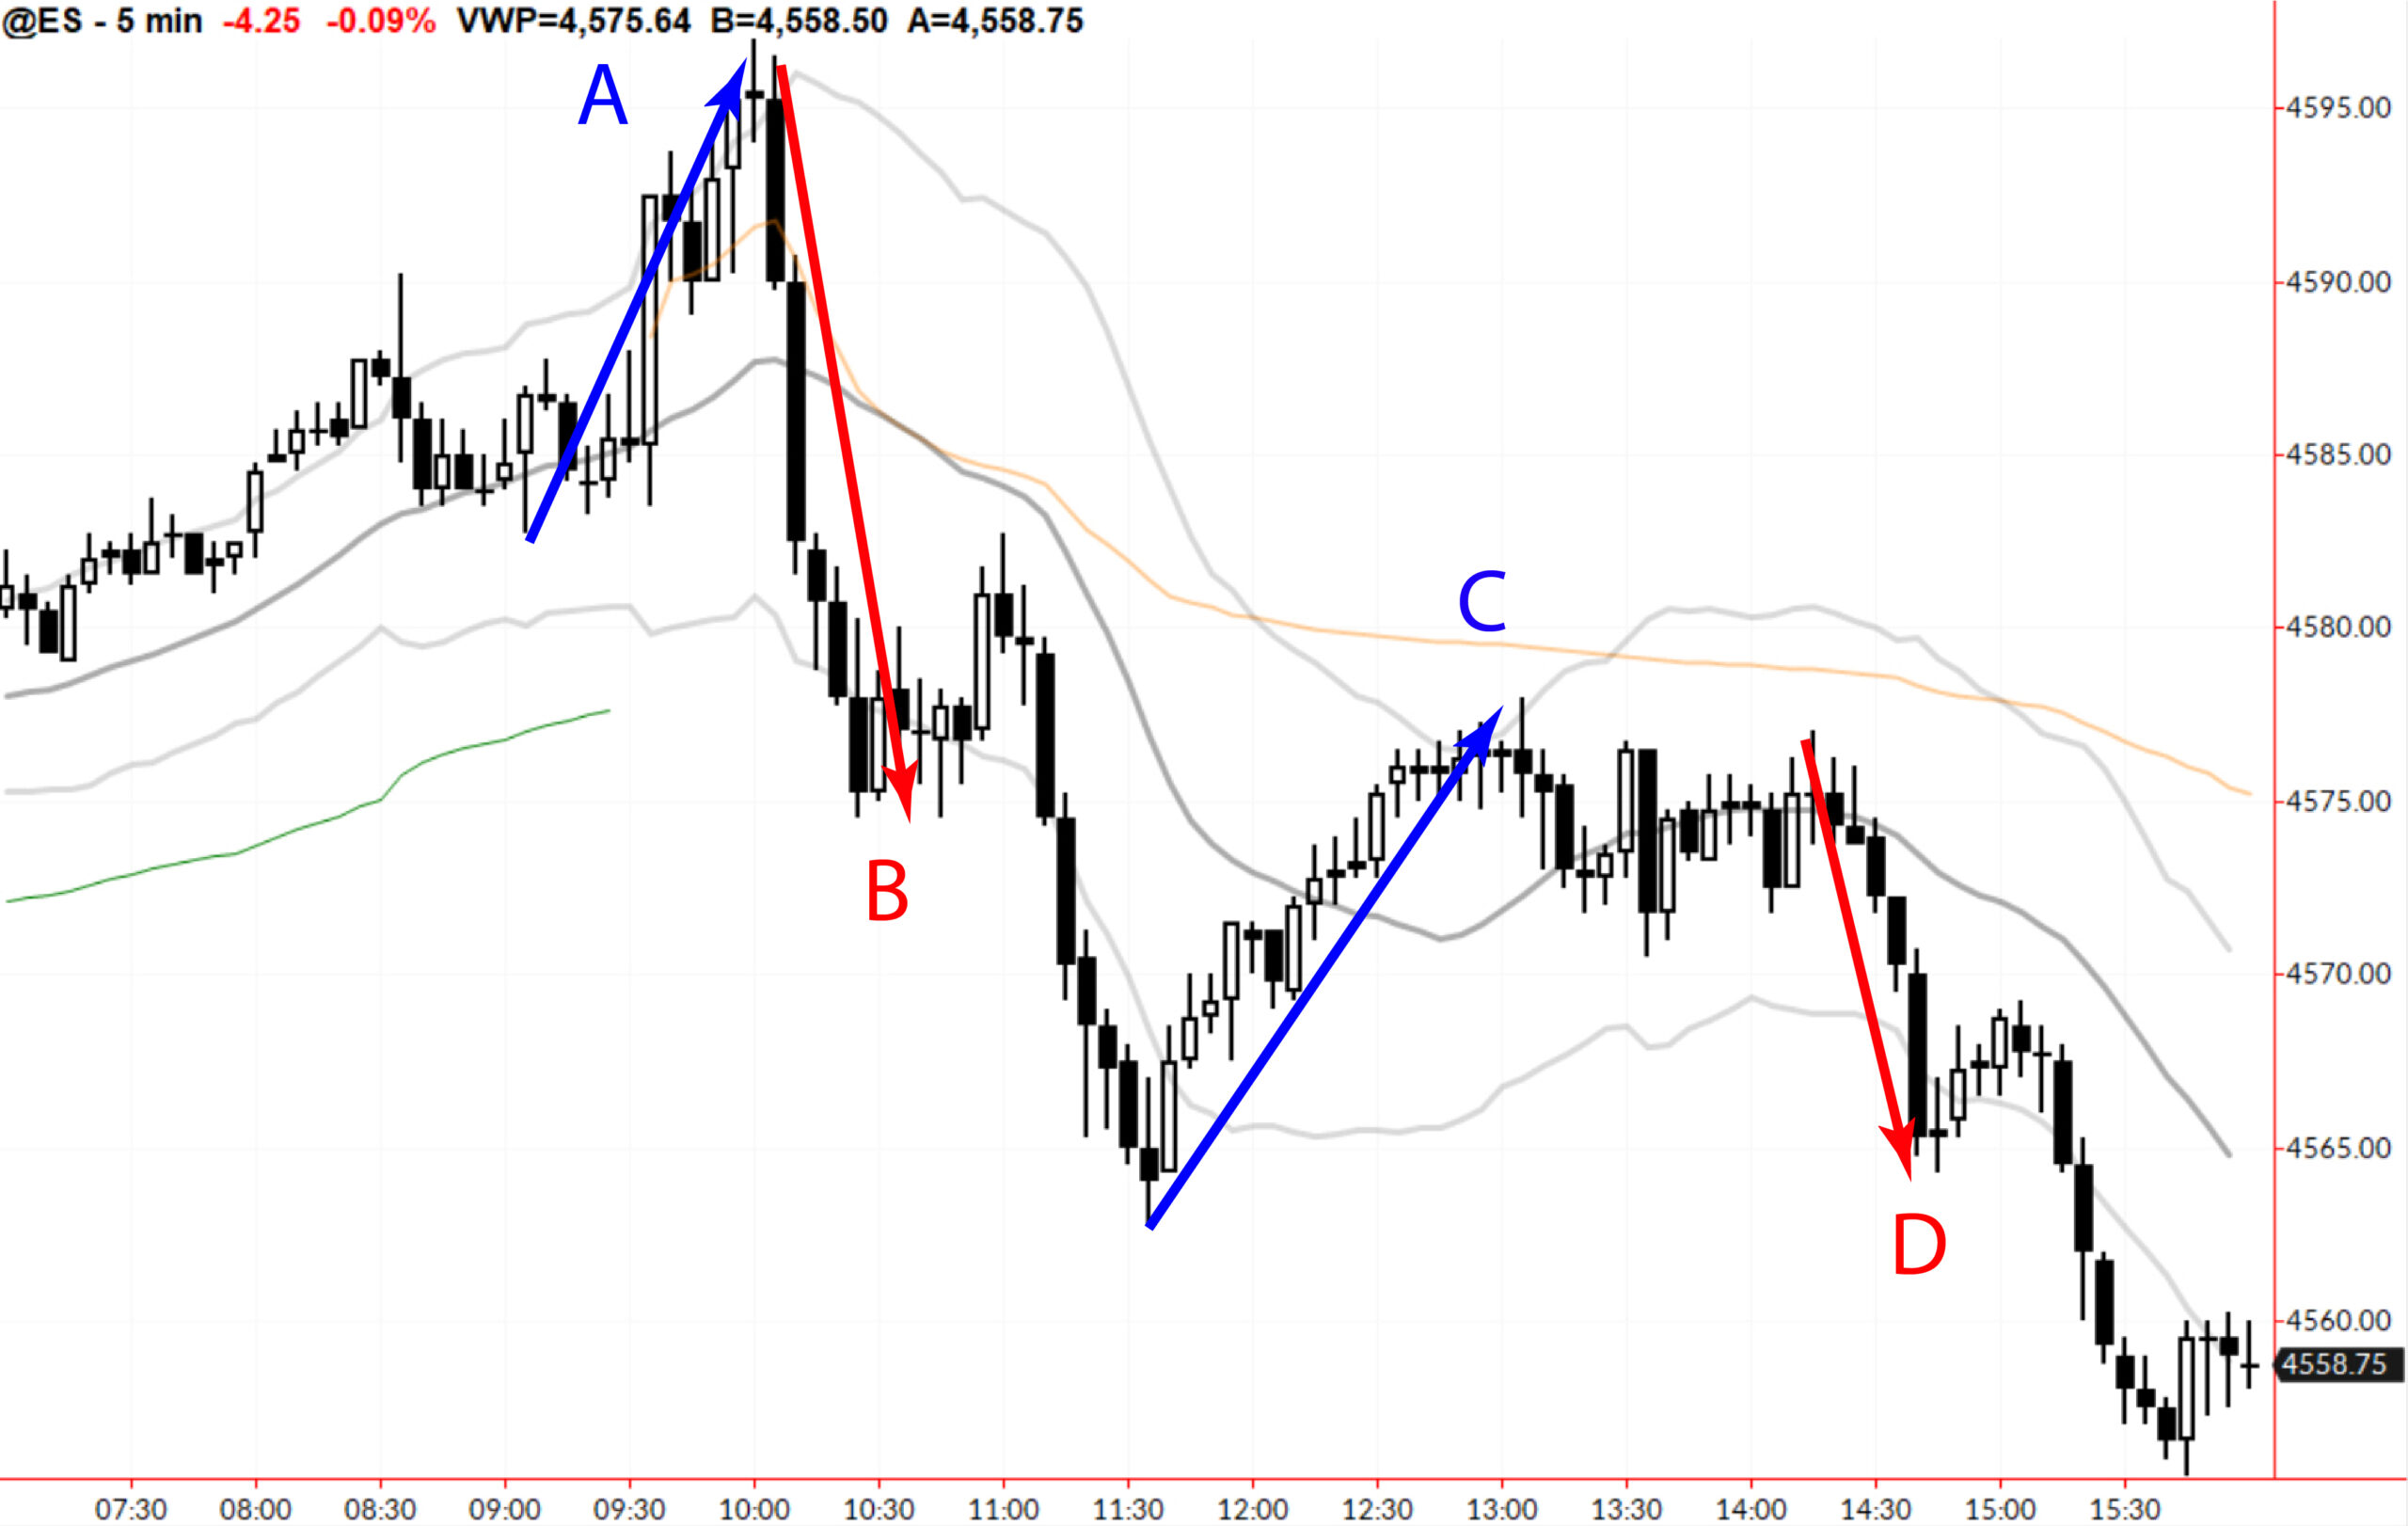
(The chart is included twice—once with marks indicating the legs we are discussing, and again with no marks so you can see the chart as I saw it at the time.)
A – This leg came after an extended premarket move, which is a possible negative. We might have reasonably looked for a long trade here: the market was up significantly and potentially breaking out on the daily timeframe. Given these offsetting factors, it still made sense to look for a long entry, and a trade would have reached a 1:1 target.
B – This move came as a “surprise” in response to a Fed Governor’s speech. (These have moved markets irrationally for many quarters now.) This is a textbook example of a leg that should have had downside continuation, and it did.
C – This is the kind of move that can be confusing for newer traders. It did hit the top channel, but it did so on a midday “drift” move, rather than on real momentum. (Note that this leg also includes a bit of a measured move structure within itself.) It ran out of steam less than 50% of the day’s range down, suggesting more of an HTF bear flag than a long setup. If you’d taken the long trade, the reversal at 13:30 was a clear indication that the trade was wrong.
D – This is an easy move to miss, but if you are a day trader, you have to see moves like this. It’s not a huge move, but it does pop the lower channel and sets up a target of breaking the low of the day. In this case, the trade worked cleanly.
Conclusion
These are concepts you can apply to any market and any timeframe. Examples drawn from intraday action are clean because they are bookended by the open and close, but the exact same dynamics rule moves over much longer timeframes.
Of course, you can’t eliminate losing trades. Even with the best analysis, there will be trades that just don’t work, and perfect setups can lead to dramatic losers. Trade management and a willingness to see the unfolding market as it is are essential for all traders on all timeframes. But these tools and principles can guide your actions in many styles of trading, in all assets, and on all timeframes.
(A video version of this blog with examples on other timeframes is available for MarketLife and TradeCraft members.)
