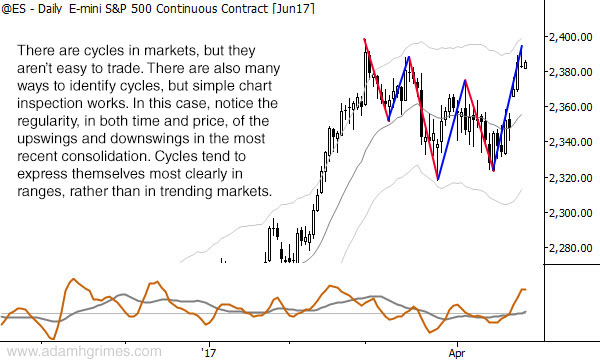
Chart of the day: price cycles in the S&P 500
- Post author:AdamHGrimes
- Post published:04/27/2017
- Post category:Chart of the Day
AdamHGrimes
Adam Grimes has over two decades of experience in the industry as a trader, analyst and system developer. The author of a best-selling trading book, he has traded for his own account, for a top prop firm, and spent several years at the New York Mercantile Exchange. He focuses on the intersection of quantitative analysis and discretionary trading, and has a talent for teaching and helping traders find their own way in the market.
You Might Also Like
This Post Has One Comment
Comments are closed.
Thanks Adam. I’ve been watching that one month down/up pattern playing out and hoping we get two more months worth of down and then up again in this 2320-2400 range. Would make a wonderful triangle and range trade!