I’m convinced that one of the biggest lies of traditional technical analysis (TA) is that “you can apply any tool to any market or any timeframe with the same results.” These claims are usually “backed up” with a few examples of an indicator slapped on some different markets and some vague appeals to the concept of fractal markets.
The concept of fractal markets is interesting and deserves some attention. (The (Mis)behavior of Markets by Mandelbrot is a good read and a very accessible primer.) To my (possibly misguided) thinking, the key element of fractal markets is that markets move in response to investors who work on many timeframes, each focusing on a specific kind of information. As long as these groups are essentially in conflict, markets are stable in their instability–chaos and instability bring a type of regularity to markets. When these investors on different timeframes turn their attention to the same factors and herd together, markets become unstable.
This is a powerful idea with far-reaching implications, but we do it a disservice to assume that this also means we can simply slap any indicator on any chart and go to town. In fact, it’s easy to demonstrate that there might be significant differences in the way different asset classes trade. The less structure we put on the markets (i.e., indicators or other calculations) the closer we are to the data, so let’s take a look at a simple channel breakout system, also often called a Donchian channel.
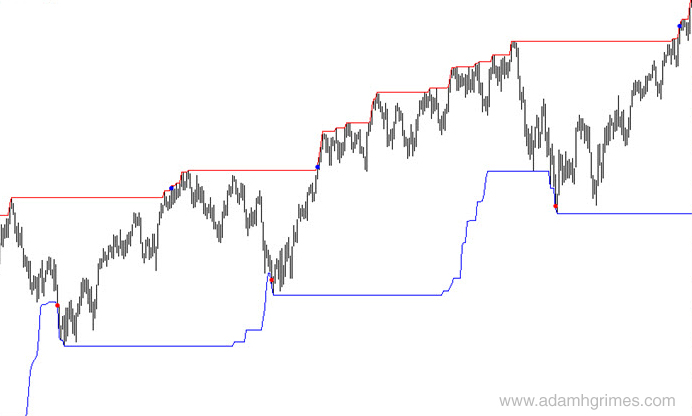
The use of channel breakout systems is well-established in trend following circles. We now know that the Turtles owed much of their success to the disciplined application of a rather simple system that used breakouts of N day highs and lows to signal entries. For trend following, it’s a good concept to start with because a market has to take out previous highs to go higher and lows to go lower. Visually, such a system might look like this:

The red (short) and blue (buy) dots on the price bars show the points where a simple breakout system would have initiated trades at the previous 100 bar high or low. One issue with a system like this is that it will mark multiple entries in the same direction, often on consecutive bars. We have to have some way to deal with that in actual trading, and I’m going to show you some tests here that use a “flip only” approach, meaning that you can only take a short after a long entry and vice versa. (In actual trading, there are better ways, but this will suffice for a simple test.)
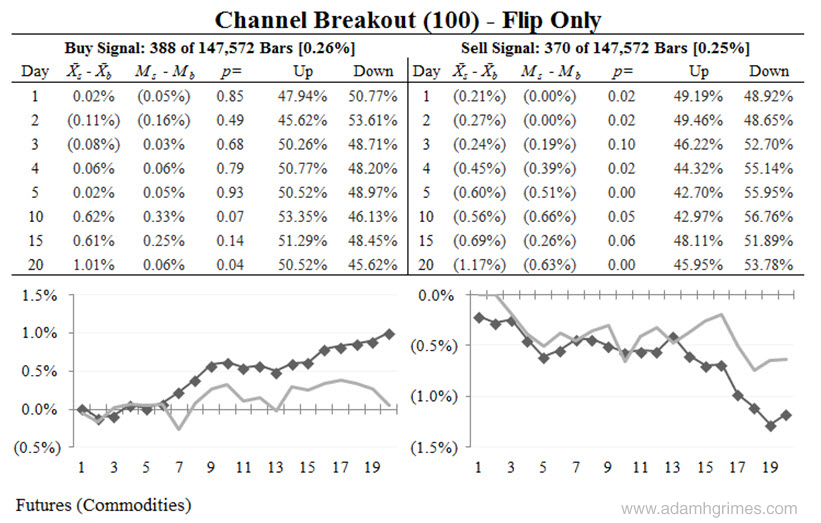
So, what happens when we execute this? Here are some results, on a basket of commodity futures:

There’s a lot of information in that table, but, for this discussion, it’s sufficient to focus on the lines with the diamonds superimposed. These lines show the “excess return” over the baseline for the sample, for each of 20 trading days following a buy or sell signal. The buys (left column) show a signal which appears to get stronger further from the entry, and the shots (right column) appear to be roughly the same–a strong, stable signal.
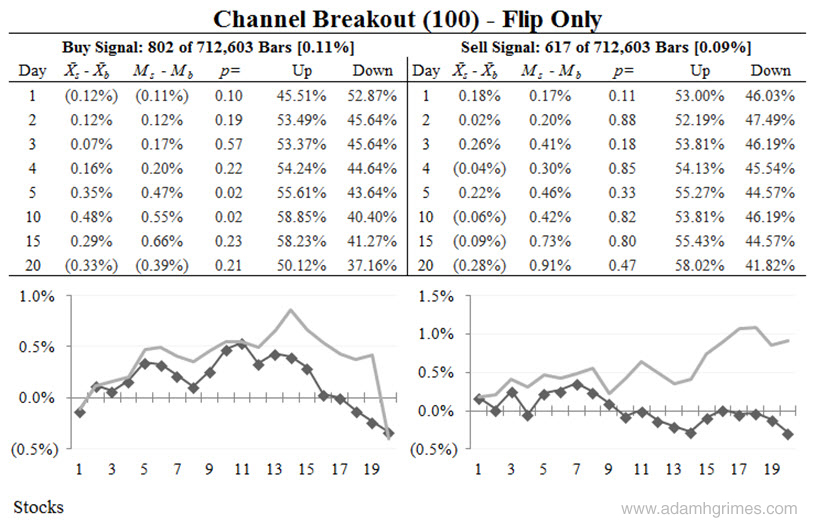
Based on this information, we might conclude that we could build a system on this breakout concept, and we’d be correct. However, let’s look at exactly the same system applied to a basked of individual stocks:

Again, just focusing on the lines below the tables, we see a very different story: both lines seem to hover around the zero line with no clear signal. Compared to the futures sample, this is a dramatic difference. (If we run the same test on currencies it looks a lot more like the commodities than the stock sample.)
What can we conclude from this? Well, it’s just a rough test, but it is an indication that something might be different in these groups of markets. My work has found this over and over, and I believe that the force of mean reversion is much stronger in stocks than in currencies or commodities. Anecdotally, we know that there are many trend following systems for commodities and funds that run these systems, but we do not have so many examples of trend followers in stocks. Furthermore, a casual look at the TA literature shows many examples of authors saying that commodities and currencies “trend better” than stocks, which might be a way to say that the balance of momentum and mean reversion might be different in those asset classes.
I’ll show you a few examples in coming days of this concept applied to some indicators and other tools. Time and again, we will see evidence that all asset classes do not “trade the same”, and evidence that seriously calls into question the accepted wisdom that you can apply any tool to any market. As always, this is a call to do your own work and research, to fully understand the tools you use, and to work hard to understand the implications of risk and trading in your chosen markets.

I always wondered how much of the success of trend following in futures was caused by up/down limits, which prolong trending but in an unexecutable way, unless you get in early enough…
interesting idea… something I’ve never thought of because I think of limits as shorter-term distortions. I don’t know that there are tradable signals in limit moves, but perhaps It should be testable… some ideas:
-does trend following work in markets which do not have limits? (yes)
-can we connect differences in trend following performance in markets with the number of times limits are hit in those markets? (no idea.)
-how about in time periods during which limits were hit more often? if so, can we separate cause and effect? (i would expect that trending markets generate more limit moves, at least in some data from previous decades.)
Interesting thought. That would make a good research project.
Is there anywhere in your work you have explained that table and how you construct it (just the concept behind it, not the code) ? It looks like a standardized way to analyze systems that throws much more light than simple statistics!
Here’s what I think I understand. The “Day” column is the lag following each buy or sell signal , and then there’s the mean/ median / P(up) and P(down) of the cumulative return up till day X. I don’t know what the ‘p’ column is.
Maybe the more important question is how do you deal with overlaps? There will be buy signals which are followed by sell signals in say, 10 days . So for these buy signals, you only consider the next 10 days, yes? (That feels like a lot of data heavy lifting!)
If my understanding is correct, there will be some kind of survivorship bias in the above analysis? i.e. trades that have lasted longer are intuitively going to have higher returns on average (else they would have been terminated sooner)? Alternatively, the further out on that diamonds chart you go, the less the size of the underlying sample , and so the significance of the test falls?
Regarding your first point, Adam goes into a lot of detail about how to build these stats tables in his ebook on Quantitative Trading, which he provides free of charge (see the right column of his website for the link). I have spent a bit of time applying his approach to gather some stats on Intraday signals on 15min bars (mainly commodity futures, but also tried it on currencies and equities futures) and I can confirm that each instrument is unique in its returns profile over n-following bars.
Now on to your second point, the way I approached the overlap problem is that I went bar-by-bar and recorded EVERY signal, which you might say results in duplicates, but I considered that more acceptable than missing a bunch of signals in the 30 bars following a signal. Looking over the data, you can manually delete duplicates but I did not find it made much difference to the results anyway.
In conclusion, my study found some weak but statistically significant returns on crude oil and natural gas (in the order of 20 – 40 basis points). When I plugged these into a Bot and (over!)optimized over 4 years of minute data I got a great system with Sharpe Ratio of over 1.0. Alas, this system failed epically in incubation (live sim account) over a few months due to my having over-optimized the backtesting (classic rookie error – but I have now learned the lesson!). One question I have for Adam is whether he has found similar results when using his system to analyze intraday signals in commodities. This is important, since trading futures (especially CL lately) on the daily requires a level of risk (and hence capital) that I do no currently posses. I have tried all sorts of intraday trading systems but none seems to survive rigorous backtesting, so I am about to give up on it and try trading spreads / options on the daily charts. The journey continues!