Know where to look...
We have limited time and attention. This is one of the realities that developing traders soon face—no matter how hard you work or how well-intentioned you are, there’s a limit to what you can look at, analyze, and understand. It’s important to filter out the noise so we know where to focus that precious resource of time and attention, but how do we do that?
Another way to ask this question is something like “what’s the most important thing on a chart?” or “where do you start reading a chart?” The answer is simple: you want to pay attention to the big moves.
Why big moves? Because most of what we see on a chart is random. Most of the time, the market moves unpredictably from point to point, and we can’t make money if the market is moving randomly. If we’re going to risk our money (and other resources like time and mental and emotional energy), we need to have some evidence that there’s an edge in the market. Looking around big moves is a good way to start looking for an edge.
So what is a big move? The answer is “it depends”, but that’s not the useless answer it might appear to be! What does it depend on? It depends on how the market usually moves; a more precise way to say the same thing is that it depends on the volatility of the market, and that’s the key: using measures that automatically adjust for the volatility of the market can help us find these big moves we want to focus on.
We can think of “big moves” either as single bars or swings—we can look at large single bars, relative to some measure of “average bar size” on the timeframe we are monitoring, or we can also look at large swings that somehow rise above the average swing length for the
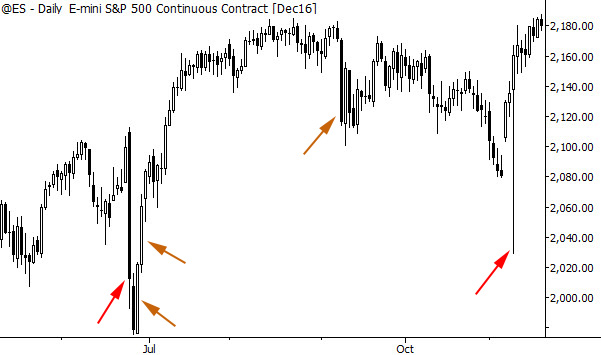
The first is visual inspection. Simply look at the chart and ask yourself which moves jump out as big moves. The problem with this is that this is a purely subjective measure. What stands out to you today might not stand out tomorrow; if you look at the same chart twice you might come up with two different answers. That answer might depend on the charts you look at before, how long you’ve been studying, what you had for breakfast—you get the idea. This certainly doesn’t invalidate this approach, but you do need to realize that it may not be fully reproducible. The chart below highlights some big moves with red arrows, but the orange arrows point to bars that might or might not be considered big moves. We also can't use this in any kind of backtest because it's so subjective. Even with those limitations, this is something anyone can start doing today and simplicity is often a good thing.

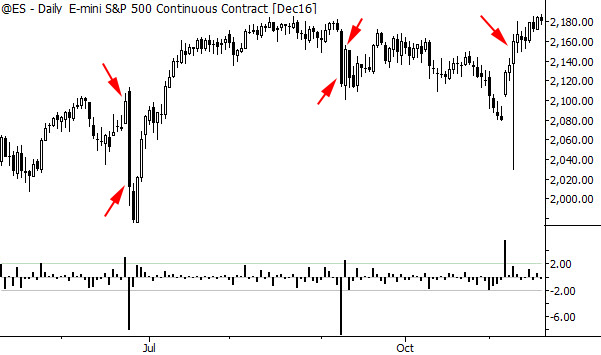
If we want to have something more consistent, we can start applying some mathematical measures to charts. One of the tools I use is something I’ve called SigmaSpikes, which is simply each day’s move expressed as a standard deviation of the past 20 trading days. One way to use it is to go through a chart and highlight all the moves that exceed a certain threshold value. (I often use 2.0) The beauty of this measure, to my eye, is that it lines up very well with the points I would pick out subjectively, but it’s an objective measure. I can scan charts for it, create screens that rely on it, look at markets that have made big moves in recent history, and use it in a backtest—all good tools to help me narrow down the universe and to know where to focus my attention.

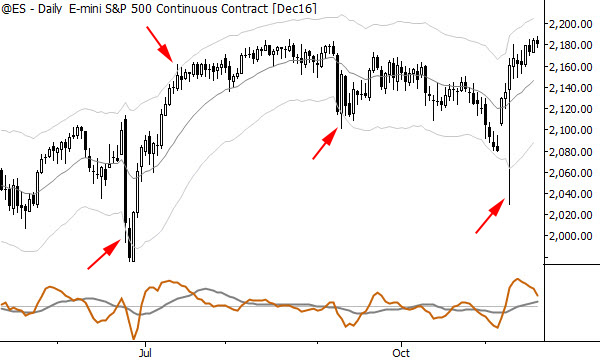
Another useful tool is to put some kind of band on the chart, and to look at the spots where the market engages the bands. Personally, I prefer Keltner Channels, but Bollinger Bands are probably more common. Don’t get too caught up in the search for the perfect tool or perfect parameters; the concept is much more important. The concept here is that we put some volatility-adjusted bands around the market and only look at the point where swings (or single bars) rise to the level of significance by touching the bands. Again, we can look at historical measures of this objective tool and even incorporate it into backtests and systematic approaches.

Many of my readers probably already use tools like this, but, if you don't, think about adding this concept to your toolkit: focus on markets that have made big, sharp moves, as these moves may point to the way to some imbalances in buying and selling pressure that could give opportunities for profits.


