When percents fail
Let's think a bit about "signal generation". When we test something in the market what we're looking for is an answer to "What happens after _______ occurs?" This is really the essence of all backtesting and system development--that question covers everything from casual chartreading to machine learning--and your trading account will win and lose based on those questions too.
So it's worth spending some time figuring out how to ask that question in the best way.
One of the things that often draws our attention is looking at big moves in markets. Of course, there are many ways to define "big moves", but let's restrict our thinking here to big single period (day, minute, month... whatever timeframe you focus on) moves.
If we simply want to measure the size of a single big move, there are three obvious choices:
- Raw price. ("What happens after a $10 move?")
- Percent ("What happens after a 2% move?")
- Volatility-adjusted ("What happens after a 2 ATR move?" or "What happens after a 2 sigma move?")
Raw price is obvious and intuitive, and it's also fairly worthless unless we are looking at a very narrow slice of data in one single market. A $10 move in a $500 stock and a $1.23 currency will obviously have very different meanings!
Percents are better, but the problem is that volatility changes in a market. You will go through periods where 2% moves are very common, and then, perhaps, years where there's not a single 2% move. Now, this may be what you want, so think carefully. If you want to pick out the high volatility areas, then setting a percent threshold will do that. (Be careful of lookback though. For instance, if we took a set of the biggest percent moves over the past 20 years, that includes information that would not have been available at the time of the trade!) Furthermore, some markets have vastly different levels of "baseline" volatility; some markets will throw you 2% moves all the time and some never will (and, this may change over time.)
In most cases, I find volatility-adjusted measures to be superior. The volatility-adjusted measure does exactly what the name says: it adjusts for the current level of volatility in the market. Two easy ways to do this are to peg something to a measure of range (ATR is common in technical analysis) or to look at a measure that considers average close-to-close moves in any market. Sigma spikes has been very helpful in much of my work.

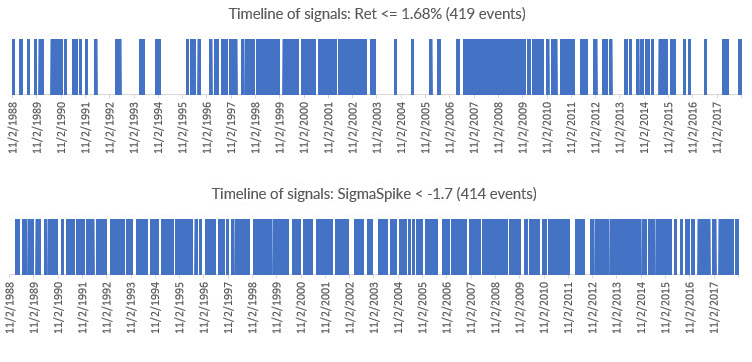
Another benefit of a volatility-adjusted measure is that signals will be spread much more evenly over the timeline. The chart above shows what happens if we mark about the 415 biggest events in the S&P cash index over the past 30 years. If we use percents, there are huge stretches where we don't see signals--for a full year sometimes. With the sigma spikes, the moves are fairly evenly distributed.
This--the even distribution of signals--is one factor to consider. You may sometimes have the signal trigger on events that you would not expect. For instance, in the S&P 500 cash index, 10/4/18 was a -2.4 sigma spike, and the largest volatility-adjusted decline since March 2018. Would you have seen that from the chart? Maybe or maybe not. Does it seem odd? Maybe, but it also gave us some warning of what came a few days later.
As with any measure, understand the tradeoffs, what the move measures, and where its strengths and weaknesses might be.


