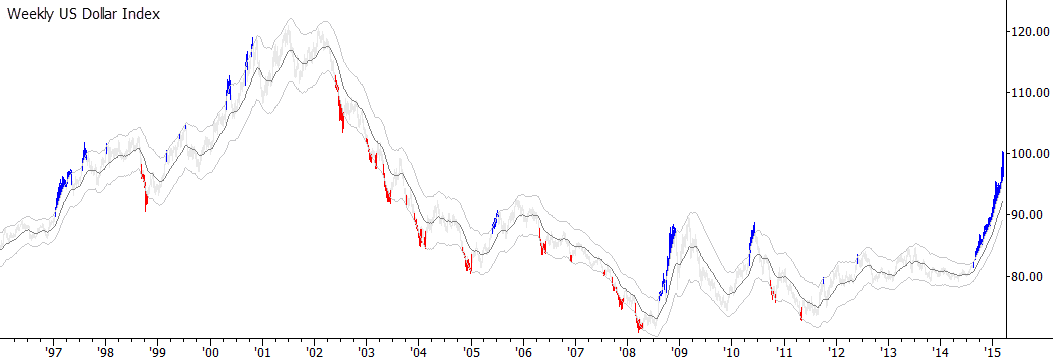
Visualizing USD trend strength
The US Dollar is in a trend of historic proportions; the strength and rapidity of its advance has shocked many other currencies as they scramble to adapt to the new US Dollar. This creates an environment with considerable risks, but also brings some opportunity for traders who understand how currencies trend and how to manage positions in currencies.
One of the tools we use to help separate what "might be normal" from "might not be normal" is Keltner Channels, which put bands on a chart around a moving average, set further or closer to the moving average depending on the current volatility of the market. If we use the same parameters on every market, we see that this is a measure that contains most of the price bars inside the bands; whenever a market moves outside the bands, something unusual is happening and we should pay attention. (If you want to dig into the stats, there are a lot of numbers here, but the bottom line is that these bands tend to contain between 85% and 90% of all price action, so markets are only outside the bands 10% - 15% of the time.)
Take a look at the chart below, which shows the US Dollar index going back to 1996, and highlights the times the USD has pushed outside the Keltner Channels. This might look like a strange chart, but it's one way to point out the times that a market has historically moved to an extreme.

A few observations:
- The current move outside the channels is longer and larger than any in recent history, but is not entirely unprecedented.
- When the market moves outside the channels, it tends to go back inside. (See the stats page.) Typically, excursions outside the channel tend to be short-lived.
- However, when markets make extended moves, they usually do so with strong extensions outside the channel. (See the 2001-2008 decline, for example.) This is why pullback trades work: the usual way markets make long trend moves is in a series of sharp "jabs" in the direction of the trend.
- Trends don't move in straight lines. Long trends have substantial pullbacks, sometimes lasting 6-18 months. Would you lose perspective in a year-long pullback? If you're a long-term trader, you can't.
So what do we do with this? Well, let's add one more piece of information, which is that trends in currencies tend to be stronger, cleaner, and last longer than trends in stocks. So if you're a stock trader, you're probably looking to fade this move in the USD, but that does not respect the reality of how currencies move--they can trend strongly, and for a very long time. Bottom line: there's no reason, based on historical precedents and price patterns, to look for an end of the US Dollar trend anytime in the near future. Plan accordingly.


