US Dollar trend update... next steps
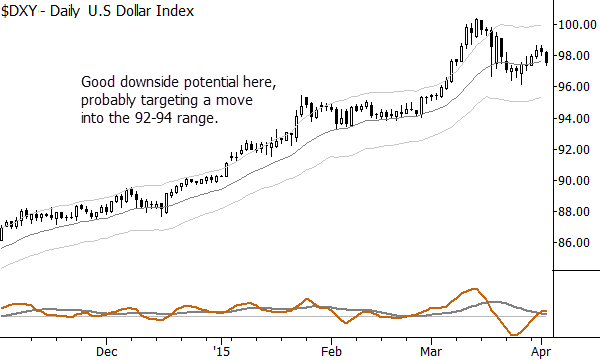
Just a quick followup to this post, in which I suggested the US Dollar might be set for a fakeout rally (that has happened) that might fail into a sharp selloff (this could be setting up.) Let's look at what has developed since I published that post a few days ago:

Reading the market's swings is largely a game of understanding shifting momentum and probabilities. We codify some of these tendencies into trading patterns, and the US Dollar currently provides a pretty good example of the Anti pattern. A simple down day like we see today might not always have significance, but, coming where it does in the technical structure:
- following a "reluctant" rally on waning momentum
- and that rally itself following a sharp decline with strong downward momentum
- this far into a long, extended trend
- with higher timeframes clearly overextended
These factors tilt the probabilities in favor of another decline. However, think a few steps further: it is unlikely this is the end of the trend, and we can look for where this downswing (if it develops) exhausts itself to possibly find long USD entries in the coming weeks.
Thinking a step or two ahead while respecting the realities of market structure and momentum can give traders a good edge. By the way, this pattern is one that I cover in considerable depth in my free trading course. If you haven't taken the course, no time like the present!


