The most important goal of chart analysis
This is the first in a short series of posts in which we will look at the basic, fundamental elements of directional trading. This series will be written for beginning traders—for those taking their very first steps—but I can promise insight for more experienced traders and investors, as well.
Think for a moment today about what you hope to see when you look at a chart. What are you trying to do? What is the most important thing? Let’s focus on that: what is the most important goal of chart analysis?
There are many answers to this question (some good, and some bad), but the real answer might be something you miss. I think what we’re really trying to accomplish is to understand the most probable future volatility environment for the market you’re looking at.
The Two Forces
That’s probably not very clear, so let’s dig a little deeper. What I mean by “future volatility environment” is, very simply, answering a few key questions about the market:
- Is the market more likely to trend or mean revert?
- Is the market likely to be more or less predictable?
- Is volatility likely to increase, decrease, or stay the same?
I’ve proposed a model of market behavior based on the twin forces of mean reversion and momentum. Momentum is the force that tries to push a market into trends, or that tries to move it from one price level to another. Mean reversion tries to keep the market more or less where it is. If momentum “wins”, then we should “go with” big moves or trending moves in a market, as those moves should lead to more movement in the same direction. If mean reversion is winning then we should “fade” (go against) big moves because they will fail.
Over a long time period, these two forces pretty much balance each other out, which is why someone looking at market data sees trends, ranges, and might even do statistical analysis that shows the market moves in a random walk. The question we should be asking is “can we find patterns that show one force is more likely to win than the other?” The answer to that question is yes, and that’s really the essence of technical trading.
How it works

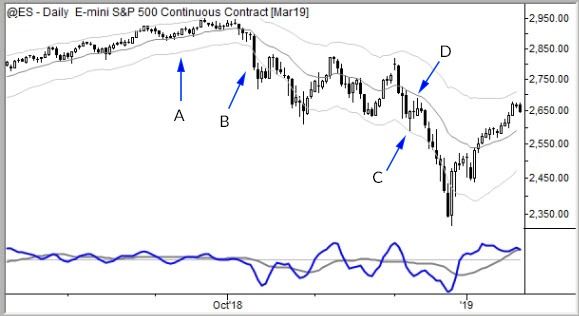
So far, this has been pretty abstract, but let’s look at some concrete examples. Take a look at the chart of the S&P 500 above, and imagine the “hard right edge” of the chart is at each of the arrows. Here’s what we might have thought at each of those points.
- A: The market is trending, meaning that momentum is winning. Most reasonable future expectation is that the trend will continue unless we see signs that something else is happening.
- B: This big bar is a surprise and breaks the trending pattern. Volatility just became much higher. A reasonable expectation is that we will see a little mean reversion sometime soon, but then more momentum and that volatility will stay relatively higher.
- C: This small bar shows us that, over the next few days, there’s the potential for upside momentum.
- D: A few days later, that potential had not led to price movement. This is a specific pattern that tells us if price moves a bit lower we can expect to see momentum (and maybe strong momentum) and generally higher volatility.
So, take a moment and rethink your approach to charts. If you’re like most traders (and like I was for the first few years of my trading career!) you are looking for specific patterns to get in and out of trades, or maybe you are looking for certain patterns that forecast something about prices.
What I’m proposing is just a small shift, but it can create a shattering shift in your perspective. This is a way to start to see the big picture, and to understand how your patterns fit into that big picture. This is a way to start to see the whole market.
So, think about that: the first task of any chart analysis is to try to understand the most likely future volatility conditions.


