Support and resistance... right now

Support and resistance is a controversial topic. Traders’ cognitive bias and random price motion conspire to play tricks on the mind. Many technical analysis books and gurus parrot conventional wisdom that has no basis in fact. Yes, despite all the reasons we should be suspicious, this is one of the most important topics for a trader to understand well.
Today, let’s look at some indications that a support or resistance level might be working. This is not something that can be predicted in advance—you can’t say “this level is going to work”. But we can sometimes see that there’s good activity going on around a level.
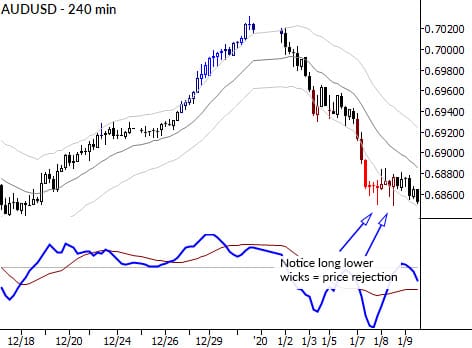
Look at the 4 hour chart of the AUDUSD below:

- The chart shows an area where price “stopped going down”. That’s a first indication of support: something is happening right now.
- Then, we start to see price rejection at the lower end of the range. The two candles I highlighted show this clearly.
- Now, price is settling down into the zone where we saw price rejection before.
How to trade it
So what do you do with this? To my mind, there’s a two-sided trade here. First, and most obvious: if we are able to clear this support, there’s the potential for a good breakdown. Seeing this type of action shows you there’s a fight around this level, and the market is likely to move when one side loses.
We probably don’t want to start a new short position right here (inside the support area). If we are holding an existing position, then the answer might be different, but this assumes you’ve taken partial profits and tightened stops on the remainder. But we probably do want to initiate a new short if the buyers lose.
So this gives us a clear trigger to short, and this kind of breakout level, where we’ve seen real action around the level, can lead to some of the best and clearest trades.
Think about both sides
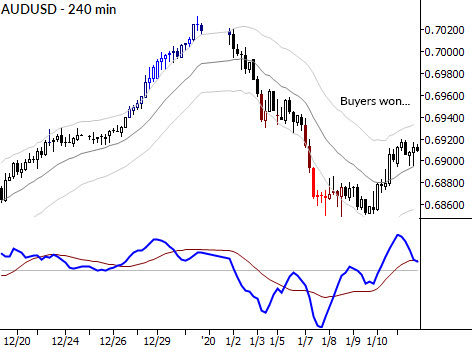
Now, who’s winning currently? The buyers have definitely been able to defend those lows, and that deserves respect. If you are holding a short and you run into this kind of action, you need to think about what might happen if the buyers carry the day.

In this case, that’s what actually happened, and the upside move was clean. This is typical action, and something that should play into your ideas about stop placement and trade management.
These patterns repeat over and over on all markets and all timeframes. You can see the same thing play out on monthly charts, and if you read order flow you can see effectively the same thing happening tick-wise in the space of seconds.
When you look at price charts or candles, think about the unfolding story rather than focusing on specific patterns or indicator lines. You might find that you soon see markets with new eyes!


