AUDUSD: Short-term inflections or trend change?
One of the key challenges for discretionary traders is balancing short-term and longer-term information. Err too far on either side, and bad things will happen: Focus too much on short-term, and we are overly responsive to every jiggle of the market, constantly stopped out by market noise. Focus too much on longer-term, and we might take larger losses more often than necessary, and might leave a lot of money on the table. Of course, this complicated juggling act takes place in a very competitive, largely random environment, and it's impossible for anyone to find the sweet spot every time. Today, I want to take a look at a live trade in the AUDUSD, and show one specific context in which we might give the longer-term context the benefit of the doubt.
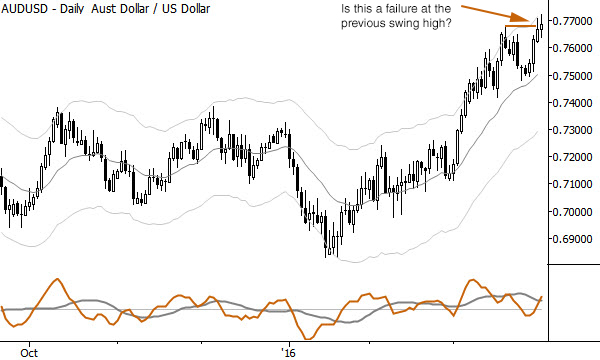
By way of background, make sure you understand the ideas behind trading pullbacks and the failure test, and that there's an overlap here: one way to define and test pullbacks is to consider taking profits at the previous pivot point (the high of the move that set up the retracement for a long trade, or the low that set up a short). When we do this, the pattern can show a win rate higher than 66%, and we often do see minor failures at these swings--these failures are, effectively, failure test entries against the trade. Why, then, would I be less concerned about this apparent failure at the previous swing in the AUDUSD long position?

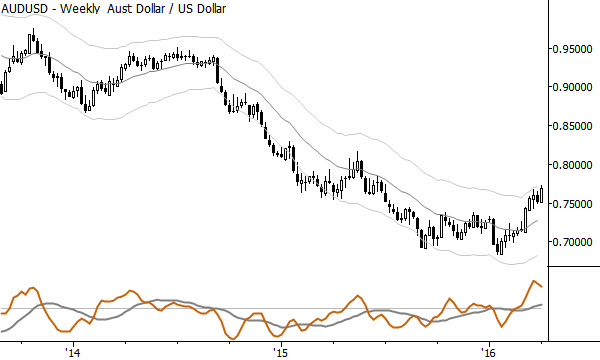
Given that chart above, should we perhaps be looking to reduce or exit the trade since the market did not make it cleanly through the previous high? At this point, I would say no, and here's why. The longer-term chart shows a potential longer-term trend change. Take a look at the weekly chart:

You can see that the weekly swing is pressing into the upper channel. While that channel is in no way a magic line and the market being there might not have clear significance, it is a good volatility-adjusted way to compare swings. What you cannot see from the chart above is that this is the first time since mid 2011 that the AUDUSD has put together enough upside momentum to press into the upper channel. We could continue to list bullish factors, but I'd keep things simple: there is a chance that this is a longer-term trend change. If we want to participate in that trend change, we might have to endure some noise. Given that context, I'm more inclined to weight the longer-term over the short-term, in this case.
Another thought here is that it might not matter. I know if I take trades like this I'll end up making money on about half of them and I'll make more on those, on average, than I lose on the losing trades, on average. That's enough--we certainly could make a good case for not overthinking and simply managing each trade on its own timeframe--this is a trade on the daily chart, maybe we should just tighten the stop as it moves in our favor and call it a day. I think most traders probably find best results as they simplify and focus, but sometimes the message of a longer-term inflection is too powerful to ignore.
(This trade example was drawn from my daily research and advisory I write for Waverly Advisors.)


