Santa Claus rally: updated stats and expectations
This is the last in a series of blogs looking at December seasonality in stocks.
To quickly recap, the first post used a simple binary (up/down) classification to look at all months of the year in graphical format. (Lesson: yes/no classifications are useful and so are data visualizations.)
The second post looked at summary stats for each month by decade. (Lesson: size of the move matters, too.)
The third post teased market action out into bull/bear/flat years and found that the tendency for a December rally appeared to be depressed in Bear markets. (Lesson: be very careful of taking multiple cuts through the data. Be careful how you ask questions.)
This post will extend the work of the previous posts into daily returns, and we will get close to something I would consider a “final answer” on the topic.
December seasonality
We've looked at month to month changes, but there's much more information available on the daily level. The table below compares the daily returns in December against daily returns for the entire year.
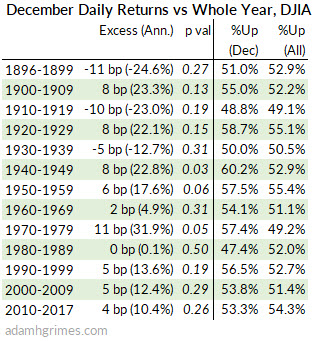
The columns are:
- Date (inclusive)
- Excess (Ann.): the average daily excess return, meaning the average return in December – the average return for all days of the year. This number is presented in basis points (1 bp = 0.01%) and as an annualized percentage. (We aren’t suggesting you could get this return for a year; it’s just an easy way to see if the return is large or not!)
- P val: a significance test
- %Up columns: the percentage of days that closed positive in December, and for all years of the decade.
From this table, we can see a few things: there were decades where December outperformed dramatically. The 1970’s stand out, but there were many other decades that saw December as a strong performer. (This reinforces the intuition we got from looking at the monthly data in previous posts.)
However, recent data is not impressive. We’ve seen 30 years of lackluster December performance, and, since 2010, days in December are no more likely to close up than any other day of the year.
Significance testing
And now we need to talk about significance testing. First, this is a complex topic. Books have been written on the topic, and entire disciplines are struggling with aspects of significance testing. It’s not impossible to think we might have large swathes of scientific research invalidated as we explore this topic in coming years.
So, let’s stay humble and respect the limits of what we know.
The idea being significance testing is to answer questions like this: “We think we see an effect. Is it real? Could it just be a lucky result?”
Think about the lucky result part for a minute. Imagine I have a box with 100 pieces of paper in it and I allow someone to reach in, without looking, and pull out a piece of paper. I’ve told you in advance that there are some blank pieces of paper in there, but there’s also some money. I won’t tell you how many of each—it could be all money. It could be all blank paper. It could be some mix.
You watch someone reach in, and they pull out a $500 bill. You watch someone else reach in, and that person pulls out another $500 bill.
Now it’s your turn. What do you expect? Of course, you expect you’ll reach into the box and pull out some money, but is it possible that there were only two pieces of money in the box? Maybe those two people just got really, really lucky, and everything else is newspaper!
You have to admit this is possible, but is it likely? Think about that for a minute.
Now, what if you watch 2 more people take paper out, and they both take out $500. How likely is it all 4 got lucky? Again, possible, but becoming very unlikely.
Imagine another scenario: same box, but we start over. You now watch 20 people take pieces of paper, and half of those 20 people get money. If it’s your turn next, what do you think your chances of getting money are? (About 50%?) Again, it’s possible that 10 of those 20 people got very lucky and got the only 10 pieces of money in the box, but it’s pretty unlikely.
So this is what we’re doing with significance testing. We look at things like sample size and variability to decide how sure we can be that the effect we see is something other than luck.
The presentation of a significance test is a little convoluted, but it’s important. We think like this: “What if there’s no actual effect in the data? (If this is true, the result we see is simply due to random chance.) Assume that for a moment—that there’s no effect in the data—if this is true, what are the chances we would see a result at least as extreme as the one we see in this test?” If this is the first time you’ve encountered that, spend some time thinking about it.
Understanding Decembers
Now we’re better equipped to think about these results. Consider 2010-2017, which shows that the average day in December is 0.04% stronger than the average day during the year. However, the significance test says there’s a 26% chance of seeing a result this extreme simply due to random chance.
That’s not very good. In fact, we can say that there’s nothing here that conclusively looks different from randomness. (Consider the 1940’s, in which the 0.08% average gain would only appear in 3% due to random chance—much more likely there’s a real effect in that data.)
[box] Understanding why it is so important to have something that is non-random is one of the most important revelations for a developing trader. Randomness is the enemy--if you base a trading strategy on a random effect your results will be--not surprisingly--random. Nothing can save you. Not money management, not psychology, not discipline. The only way to make money is to have an edge over randomness. So, if you look at these tiny effects and think something like “well, it might be tiny but it’s still there so maybe we should use it”, I can’t conclusively say you are wrong. You might be right, but it's probably a good idea to focus on ideas that are more clearly not random. This is where we find our edge.[/box]
To me, that’s the bottom line for Decembers: if there is a seasonal effect, it’s vanishingly small. And it vanishes in the noise.
It is not reliable, and it is not large. It really shouldn’t be a big part of our thinking.
The real Santa Claus
Maybe this is more of a historical note, but a December rally is not the Santa Claus rally.
The Santa Claus rally comes from the work of Yale Hirsch and was defined in the 1973 Stock Trader’s Almanac thus:
“Santa Claus tends to come to Wall Street nearly every year, bringing a short, sweet, respectable rally within the last five days of the year and the first two in January. This has been good for an average 1.3% gain since 1969 (1.3% since 1950 as well). Santa’s failure to show tends to precede bear markets, or times stocks could be purchased later in the year at much lower prices. We discovered this phenomenon in 1972.”
Here are the stats for the real Santa Claus rally:
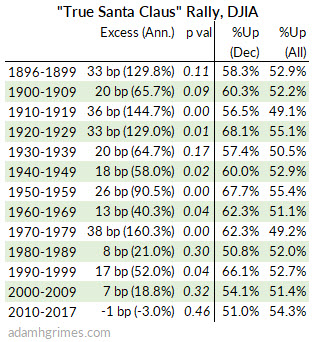
From this table, we can see that the Santa Rally, as identified in the early 1970’s was an impressive phenomenon. However, like so many other anomalies, once published, the edge appeared to degrade. 1973 and 1974 were good for Santa, but the next decade proved tough. Here are the average daily returns for each year of the decade after the tendency was first published: 1973: 118 bp, 1974: 119 bp, 1975: 37 bp, 1976: 63 bp, 1977: -18 bp, 1978: -42 bp, 1979: 23 bp, 1980: -41 bp, 1981: 56 bp, 1982: -21 bp,1983: 3 bp.
Firm answers to seasonal influences will always be elusive, but we find that, given a careful examination of the data, the so-called Santa Claus rally has decreased in effect since its publication in the early 1970’s. In recent decades, the magnitude of the effect has declined, and it fails to achieve statistical significance. Furthermore, we do not think the degradation of this effect is due to anticipatory buying before the published "Santa effect period", as the buying pressure does not spill over into broad December. We cannot assess whether the sharp divide in performance is due to some aspect of market dynamics we do not fully understand, but it is strongly suggestive of some data mining effect in the research process.
Bottom line: We can't count on Santa.
Wrapping up
Let me leave you with a few final thoughts. Many of you reading this disagree with my conclusions here. You know there's a Santa rally, and it's stupid to think otherwise! You are irritated you just wasted five minutes skimming another post debunking a tendency. This guy with all his numbers and tables doesn't realize that people go shopping for stocks at the end of the year so of course they go up. Right?
Why are you so sure? Stop. Think about that a moment. (For the record, my internal mental map tells me there's a Santa rally. I believe this, but I know the data says otherwise. I can't disagree with the data...) You aren't disagreeing with me--you're disagreeing with a pretty simple analysis of 100+ years of market data. So why are you still so sure there's a Santa rally?
I think it's because of the cognitive bias called the anchoring effect. Of course, sometimes we get a rally in December. When it does, we smile knowingly and say "ahhh... the Santa rally. I knew it. Works every time."
Well, no, it doesn't work every time, but we only remember the times it does work. We attach undue significance to those times it works, and we remember them. We conveniently forget all the other times, or rationalize them away in some other way. There's probably a whole course in trading psychology in those previous 4 lines, so maybe read them again. I won't belabor the point here.
Last, the real problem with seasonality is variability in the data. If you have time, watch this video in which I show how actual, valid seasonal tendencies can be swamped in the noise of normal market movement, and how seasonal analysis can create patterns where none exist. It's not the greatest video I ever made, but I think it does a good job of building mathematical intuition in a non-mathematical way. Check it out.


