Price action triggers: how much patience is too much?
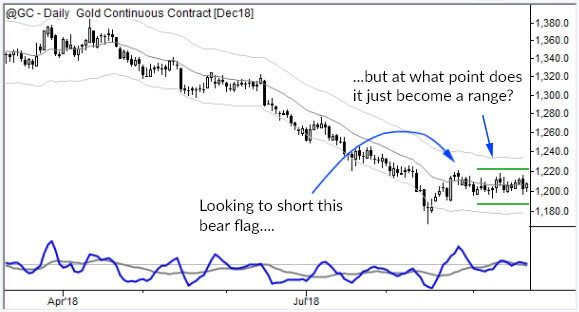
Take a look at the chart below. We were looking to enter a short in gold (or silver), based on the long downtrend, and then a bounce that was likely setting up to be a bear flag. We also knew that there was reason to be cautious and to expect the trade might fail: first, this was an extended trend. Second, the action in mid-August hinted toward at least a minor selling climax. Regardless of the negatives, it was worth looking at a short entry, entering on a breakdown out of the marked bear flag:

Now, there are many ways to enter trades, but one technique I’ve become especially fond of during the last 10 years is to enter when a pattern breaks in the expected trade direction. This means that we will not, for instance, be short during a bear flag while the market is rising; we will let price action trigger us until the trade.
The beauty of this technique is that you can be very wrong on market direction (and I frequently am wrong!) and not lose any money. If you thought the pattern was a short but it never broke down, you’ll just watch it go up with no involvement.
Of course, nothing is perfect. Sometimes we are “tricked” into the trade with a small move that quickly reverses. Another weakness of this plan is that it doesn’t work really well for directional options trading. With options, you usually don’t want to wait until the market breaks in your trade direction, but that’s another blog post…
So, looking at the chart above, we see that the short did not trigger--the market simply went into a range. The question is, at what point do you stop tracking the trade and looking for an entry? (This question might be more important than you think, because what if you were short? At what point do you execute a time stop and get out of the trade?)
If you were hoping for a firm answer, this is not that kind of blog! :) Rather, my job is to raise the question and make you think about the range of possible answers. You could use indicator patterns, structure on a higher timeframe (I would not find lower timeframe structure to be compelling in a case like this), or other rules to tell you when the trade has eroded. At an earlier time in my career, I had specific bar counts and other rules that would keep me out of a trade like this. Today, I work in a more subjective framework, and experience has shown me that I should usually work orders a few days past the point I would normally throw in the towel--there is a long line of "missed" trades behind me where I stopped tracking trades that, just after, broke in the trade direction.
It is also worth noting that this is one of the standard pullback failure patterns I outlined in my first book,
The Art and Science of Technical Analysis. Understanding how patterns fail is important for trade management, but also for trade entry. From page 313 of that book:
Every edge we have as technical traders comes from an imbalance of buying and sell ing pressure in the market. We get into pullback trades... under the assumption that the pressure driving the trend will continue after the pause that creates the pullback. If this assumption is incorrect, the market may simply go flat after the trade is entered, without a significant move up or down. This is strong evidence that the market has temporarily found equilibrium and that whatever edge there might have been in the trade is now gone.


