Markets Unlocked: Contraction underway 1/23/22

The week ahead will feature some potentially market-moving datapoints. Watch, especially, GDP on Thursday and PCE on Friday.
Current technical position
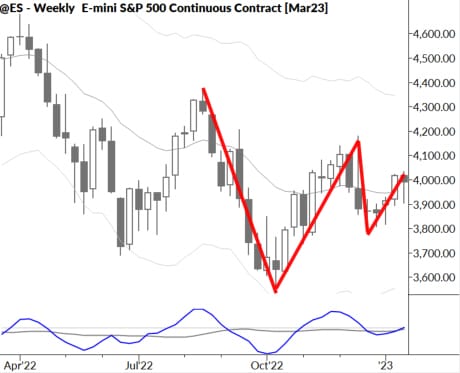
The past week saw some of the strongest selling pressure in over a month, but buyers stepped in at the end of the week to arrest the decline, painting a weekly bar with a long lower tail. This is one of the classic signs of potential accumulation/buying pressure.
Overall, we think the weekly chart paints a picture of volatility compression. (See chart at the top of this page.) Going back to late summer, the pattern has been contracting swings on the weekly chart, with weekly bars chopping on both sides of a flat moving average. This is a difficult trading environment, and directional calls are difficult.
Classically, traders expect strong breakouts from these areas, but we remind our readers that failure is always an option! A good percentage of these patterns resolve into further sideways action--a listless, dull market. Do not assume a breakout must occur on your timeframe.
We still think bigger-picture concerns loom, and maintain a bearish bias over longer (months) timeframes. However, recent inflation data does appear to be strong. While we think it's correct to wonder just how these numbers have been shaped by reporting agencies, there's also the possibility that inflation may be under control. However, we would bet otherwise.
The week ahead (key economic releases and datapoints)
- Monday: None
- Tuesday: Manufacturing & Services PMI
- Wednesday: None
- Thursday: Jobless Claims, GDP, Durable Goods, New Home Sales
- Friday: Consumer Spending, PCE, Pending Home Sales
Earnings season continues to pick up momentum, with over 500 names reporting this week.


